Category Archives: Early Retirement

Retirement

Run your own fixed income annuity

Fixed Income Annuity - 19th Century Book - 20200504

Sometimes you just want to make the guaranteed risk return with the possibility of some upside, but with a guaranteed return of principal. This is typically where fixed annuities come in, however they can be expensive with up front load or annual management fees. Fixed annuities can also be structured in an opaque way where it is not clear exactly what investments the product has bought and how they are managed (e.g. trade turnover etc) – in short they are not very transparent.

Please note: A fixed income annuity is a very complex contract between you and the insurance company. Therefore it is not perfectly compared with the actual investments described in this blog – but this is a starting point to see if the flexibility of doing it yourself might give you some more transparency.

So … is it even possible to run your own fixed income annuity style investment ? Preferably with minimal management, without all the fees and long lock up periods. This blog post is a look back at an annuity style strategy that has been executed for the last few months.

Lets assume we’d like to do this with a lump sum principal of $100,000 USD. It is pretty easy to create medium term US treasury portfolio which is close to the risk free return – lets assume we can construct an equal weighted multi year duration portfolio of treasuries up to 5 years out. Technically there is some duration risk on the longer dated treasuries, but it’s decent proxy for a stable risk free return portfolio. A few months ago in Feb 2019 this had a blended rate of approximately 2.5% – yielding about $2500 a year in interest. See this table for the basic treasury portfolio construction:

Price DateUS Treasury DurationUS Treasury Yield (annualised)Principal AmountYield Amount (annualised)
13th-Feb-20196 months2.51$20,000$502
13th-Feb-20191 year2.55$20,000$510
13th-Feb-20192 years2.53$20,000$506
13th-Feb-20193 years2.52$20,000$504
13th-Feb-20195 years2.53$20,000$506
TOTALS$100,000$2,528
See prices from US Government Treasury website

Managing interest rate risk

However over the next few years, rates might go up or they could be cut. Ideally when each treasury expires we’d like to be able to roll into a new treasury bond with a similar or higher interest rate. However by the time that happens the interest rate market could have moved. So how to manage that interest rate risk without risking any principal?

Since Bond prices will increase when interest rates go down some hedge needs to be provided against falling rates. More simply – something that makes money when rates go down.

In March 2019 we started adding to the above treasury portfolio, by using limited risk bullish short put spread in TLT options. In theory TLT should go up if FED was to cut interest rates and go down if rates rise. TLT contains bonds that have an approximate 17.8 year bond duration, so it is not a perfect proxy for own mini fixed income portfolio that has an average duration of about 2.5 years – however it should be correlated at least. Plus TLT does have very liquid options market that is a couple of pennies wide and can often get filled at mid price, so we can be confident of getting liquid fills on the option trades.

This TLT “short interest rates” trade can be done fairly simply using an ATM bullish put spread, with a slight time decay in your favour on trade entry. There appears to nearly always be a small amount of extrinsic value in an ATM put spread appears to be consistently available, because TLT itself has an actual yield – so you would expect to get paid something for holding it for 90 days even if (all other things being equal) the price never moved. For example if the market is $125, you can sell 5 contracts of $126 put and buy 5 contracts $124 put 90 days out for a credit of $1.05. That would give approximately $0.05 of extrinsic value with $1.00 of instrinic value. If TLT rallies over $126 by expiration can make $550 for that quarter, if it closes below $124 lose $450 for that quarter. Obviously if rolling the put options is considered this becomes way more complex, but waiting to close until near expiration is the simplest case.

If you want to replicate a true fixed annuity with no risk to principal, you’d have to be careful size each trade to not risk too much on each TLT put spread. Lets assume we will do one put spread per quarter, and risk $500 per quarter per spread – that would mean in theory we could lose $2000 ($500 x 4 quarters) on the spreads. However since we gain $2500 in treasury interest, so we’d still be $500 ahead for the year. Not great obviously, but that is the theoretical worse case scenario and if we want guarantee to maintain principal then we have to be cautious with the risk. This is an annuity strategy where aim is to take some market risk but only with money gained from interest payments, never from the principal.
If you wanted to take equity risk as well, this could be applied using SPY option spreads, but recognize that is obviously not as tightly correlated to US treasury rates as TLT.
If you did lose money on the TLT spread, that would be an advantage to you when you come to re-invest any expiring fixed income, because the treasury rates would be higher.

To clarify the idea here are a couple of actual trades to show the principal. One is a simple bullish put spread. The second one was a combination of bullish put spread with a bearish short call spread sold against it.

TLT bullish put spread

This trade was entered into in March 2019, then exited closer to May 2019 expiration on 1st May. There was a $369 profit as TLT had traded up slightly. This took approximately 50% of available profit.

 
Trade Date
Category
Trans Type
Description
Symbol
Quantity
Price
Amount
21-March-2019
Hedging
Buy to Open Long Put
Put TLT 121.00  EXP 17-May-2019
TLT190517P121
5.0
0.88
$434.64

21-March-2019
Hedging
Sell to Open Short Put
Put TLT 124.00  EXP 17-May-2019
TLT190517P124
-5.0
2.36
-$1,182.24

TOTAL
-$ 747.60


TLT bullish put spread with bearish call spread

A couple of days later on 3rd May a similar bullish put spread trade was opened June options, but this had an overwrite with a call spread to give the trade some option premium to sell. Normally trades would be rolled the same day, but there was a couple days in between trades because the earlier trade was trigger by a limit order (and didn't notice position was exited).

 
Trade Date
Category
Trans Type
Description
Symbol
Quantity
Price
Amount
01-May-2019
Hedging
Buy to Open Long Put
Put TLT 121 EXP 21-Jun-2019
TLT190621P121
4.0
0.49
$194.24

01-May-2019
Hedging
Sell to Open Short Put
Put TLT 125 EXP 21-Jun-2019
TLT190621P125
-4.0
2.24
-$896.79

01-May-2019
Hedging
Sell to Open Short Call
Call TLT 126 EXP 21-Jun-2019
TLT190621C126
-4.0
0.60
-$241.75

01-May-2019
Hedging
Buy to Open Long Call
Call TLT 127 EXP 21-Jun-2019
TLT190621C127
4.0
0.45
$178.24

TOTAL
-$ 766.06


This trade was entered into on 1st May 2019, then exited closer to June 2019 expiration on 3rd June. This holding period fits with the 30 day rule. Unfortunately selling the call spread did not help the position here as it lost $345.97. If TLT had been flat to slightly down then the call spread would have made money. Fortunately the bullish short put spread made most of the profit ($694.02) because TLT had traded up significantly higher. Exiting the bullish short put spread and bearish short call spread together as a combination though made a total profit of $348 ($694.02 - $345.97).

For reference here is an interactive price chart for TLT that can be used to see the prices from Feb 2019 to June 2019. On chart use minus (-) zoom control to zoom out, then click, hold and move mouse to the right to navigate back to 2019.

Fixed Income Annuity - Summary

This blog post showed how it is possible to take small profits out of TLT to increase yield, but with limited risk if TLT goes down. In this real life example TLT went up, so the May and June spread trades added a few hundred dollars in yield. However if TLT did go down that would be an advantage to the main US treasury principal because new bonds could be bought with higher yield to expiration. This might need some tweaking to make into a better results, but it demonstrates the idea. There is approximately 30mins monthly effort required to analysis, enter, monitor and roll the TLT spreads. Running your own "annuity" product is potentially a lot cheaper than an traditional annuity that charges upfront load fees and annual fees.


Can high expenses actually save you money ?

What is the utility value of your expenses ? How do you quantify what you get for your spending ?

Sometimes expenses are just that – spending on services that don’t typically have any major long term expectation of any financial return – for example: dinner out, netflix subscription, dry cleaning bill (etc).

Sometimes though spending can get you into opportunities you wouldn’t otherwise have had. For example, spending $5 on lattes everyday according to some is taking from your financial future with small daily luxuries that add up over time – leading you to ultimately miss out on huge amounts of compound interest on your investments. However maybe the down time away from daily life while you get your coffee, gives you enough thinking space to come up with your next great business idea. Arguably people can think without coffee (at least I’ve heard rumours of such people) – but maybe that’s what you personally need to be that organised in your thinking. So maybe that annual investment was 100 x $5 lattes = $500, but you thought about an eBook which ultimately generated $500 in sales – so that would be arguably break even on your coffee investment (apart from your time).

A more extreme example might be renting walking distance from work in an expensive city versus commuting. How can you justify spending thousands extra per year just for a lifestyle choice ? That is crazy money for a lot of people, but that is relatively easy to burn through in a high expense metro area, just renting a decent apartment in a nice neighborhood with the family and a couple of kids. For example rent can be conservatively $50k a year for a 2 bed apt in Manhattan. Rent outside the city would be say $30k a year, so you can save $20k a year on rent by commuting. But then you have pay for (maybe) a car to drive to the station, then battle the train and all those other people that seem to inhabit cities. So bottom line maybe you end up saving $15k, but you are spending say an extra 2 hours a day travelling, which is 10 hours a week or 12.5 work weeks per year commuting. For some people, commuting could increase your stress levels significantly, but it might not. Some people I know are very productive on their 7am commute, and clear all their inbox before they get in the office at 8am, and then leave early at 4pm to be back home for 5pm with the family. But that requires flexible employer working arrangements and personal discipline – i.e. no happy hour in the city after work.

If you work close to home, there are intangible benefits like being able to go home at lunch to quickly get some task done. Being able to use the time productively. You can walk everywhere, so arguably don’t need a gym membership. You have the mental and emotional energy to do the things that must be done at work. If you are in a job that has a significant annual bonus tied to performance, your competitive edge can be living and working close to work – you quantify the success of the strategy at the end of the year. Using the above example, if your after tax bonus makes more than the $15k savings difference, then you could consider your “excessive” rental spending for that year to be a win. If you are not in a job situation that has a bonus, then arguably it is just a lifestyle choice, maybe not a good financial choice – but that might be justifiable for your personal approach to life, but at least understand your trade offs.

Arguably in this situation you have “spent money to make money”, lowered your stress and improved your quality of life. There can also be a short term monetary value on reducing general life stress (like commuting) because it frees up your time and your mind to actually think about other opportunities. However also there can be long term benefits in terms of reduced future health care costs due to stress related issues, but that is obviously harder to quantify.

Its not what you make, its what you keep
In an earlier post we worked out your actual after tax savings rate, and decided this is way more important than just your salary or your actual expenses. It figures out “how much do you keep?” not the usual question of “how much do you make?”, so it is a much better measure of financial improvement. Importantly this number easily allows comparison between different peoples financial situation.

Without getting too technical, as a quick recap the calculation for after tax savings rate is:
your after tax hourly pay MINUS your actual living expenses DIVIDED by your hours worked per week.
If you haven’t previously, you can quickly work is out here using this calculator.

Individual salary and expenses alone doesn’t tell you much, but how much your Actual Savings Rate towards your personal target is much more important. A person that saves half of their earned money (after expenses) can have a better shot at early retirement, than someone who makes twice as much but only saves 10%.

Income Split between couples
It’s a good sound bite to say “oh they make tons of money”, or that couple “spends way too much”, but its usually too simplistic figure out to figure out if they are financially “successful”. Lets look at some different couples, where both people work and they have varying different income and expenses. But first some definitions so we can compare the couples together.

Couples – considered to be two people in a household, where either both or one person works. Click each link in the table below to see their projected early retirement date.
Income – Annual after tax pay on the first line. The person 1 and person 2 pay split is on the 2nd line in brackets, with the highest earner first.
Expenses – Annual actual living expenses
Savings – Annual savings (Income minus expenses)
Only One Person Working Savings – Annual savings if highest paid person in the couple stops working (either voluntary or involuntary)

The following tables gives some example numbers for well paid professional couples working in a large US metro area in 2016, but absolute numbers are not as important as the ideas behind each couple. The numbers can be adjusted up or down as appropriate for your situation.

CouplesIncomeExpensesSavingsOnly One Person
Working Savings
Couple 1$200k
($100k/$100k)
$100k$100k$0
Couple 2$250k
($250k/$0k)
$100k$150k-$100k
Couple 3$150k
($120k/$30k)
$50k$100k-$20k

Couple 1 has high expenses, so most people would say they have a higher leveraged lifestyle. However if either person in couple 1 lost their job, they could still survive without cutting into savings.

Couple 2 makes the most money, but have high expenses and one point of failure being totally dependent on one salary – however they would stereo typically be seen as the “most successful” couple by many people.

Couple 3 have the lowest expenses, so they would probably be seen as the most financially prudent because their expenses are lower, but still have some employment risk because if either couple lost their job they’d have to use savings to live on.

So the way the income earned is split between the partners in a couple can also reduce risk, as well as just salary and expenses. In a couple, if either persons salary can cover total expenses, then there is a less risk that just relying on one salary. If one partner earns significantly more than the other, running side projects for income could be use to make up difference between the 2 salaries.

Summing Up
High expenses don’t necessarily mean that someone is saving inefficiently. Also the way income split is earned between couples can become a risk as well. Many financial blogs simply argue that if you have high expenses you are divorced from reality and the only solution is to reduce expenses. However for example high annual expenses could just the cost to able to live comfortably in an expensive city, that allows you to get a reduced stress opportunity at making the big bucks. High expenses can potentially disappear after leaving the city either for a career change or retirement. Assuming the expenses are not addictive “must have” lifestyle choices, they could easily be reduced long term – its not all going on day spas and massages (!) often just on basics like rent or daycare.

The point is not lecture on “this is right, this is wrong” approaches, but to actively understand why you are making active spending choices and if you can optimise them to improve what you keep in your take home pay.

Sizing investment risk using your savings rate

Using your actual savings rate can be a good way to determine what size an investment should be, if you are not sure “how much” is too much. Basically if this investment went to zero, how much time would I have to work to earn it back ?

This calculation assumes you have a job and you save money. If you get paid a bonus, you might want to include that in the calculations, but to be conservative this will just consider base salary numbers. To do this we need to look at some definitions:

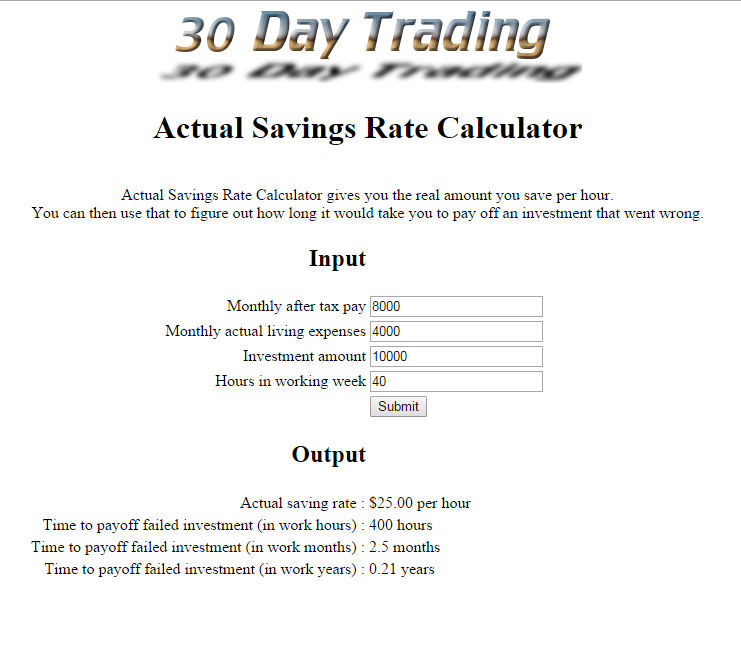
Monthly after tax pay – means the amount you get in your checking account every month after tax and everything else has been deducted. This will typically be pay that has had the following removed: federal tax, state tax, 401k contributions, health care premiums and commuter benefits. Furthermore we will assume that retirement savings like 401k contributions are not included in the calculations, because we are trying to deal with our after tax pay rate. Obviously 401k contributions are “savings” but the idea is to try to come up with calculations that work with month to month after tax pay, effectively your real working monthly budget of “money coming in”. Lets assume this is $8000 a month.

Monthly actual living expenses – means everything in your budget you need to live in an average month – including housing, food, entertainment, travel (etc) – basically everything. The monthly amount will move around in some months (for example if you pay for a holiday) but a decent start is to calculate use last year’s total living expenses (divided by 12). Lets assume this is $4000 a month.

Actual saving rate – this is all of your after tax income minus your monthly expenses. Therefore using the above examples that would be $8000 (income) – $4000 (expenses) = $4000. Assuming a 40 hour work week, this means your actual savings are $1000 a week, $200 a day or $25 per hour.

Time to payoff If you lost the entire investment, how long would it take you work to “pay off” the loss? For example, if you invested and lost $10,000 it would take you approximately 10 weeks of 40 hours (or 2 and a half months work to pay it off).

You can access the Actual Savings Rate calculator and below is a screenshot of the calculator with these values:
Retirement - Actual Savings Rate Calculator - 20160213

Consider another more extreme example. If you have been fortunate enough to accumulate a $1 million portfolio, we could use a very simplistic “worse case scenario” giving a 50% haircut to $500,000. Using the $25 per hour work rate (from above) it would take you approximately 20,000 work hours or 9.6 years to pay that off. Just think about that in relation to your existing stash, particularly if has been allocated into one strategy like a Modern Portfolio Theory asset allocated portfolio.

Very few standard financial risk assessments look at the individual work time required for this “replacement risk” of earning back lost money. They typically include only a before tax salary number and a percentage saved of that salary – which as we’ve discussed previously it is not that useful a number.

Understanding your risk along the way at all points in your portfolio life time, from starting working to almost finishing. Don’t simply buy the usual argument that risk in the early years “doesn’t matter” because you have time to make it all back. Now you can actually answer the question, how long is it going to take to earn all this back if it goes wrong ? You may now look at risk in a different way.

Paths to Financial Freedom

The American dream is supposed to be if you work hard, make a few sacrifices, then you’ll ultimately be a millionaire or financially comfortable at least. But why do some people feel like they can’t get ahead ?

Historically in our parents generation there was more job security and results were more linear – e.g. work for 30 years, save a similar amount each year, bit in the bank, bit in stocks (biggest bull market in history) and away you go into the sunset.

The standard middle class track has arguably been suffering since year 2000, and there is this overriding sense that somehow the average person is getting short changed or it’s harder for them to get ahead. In that period there has been market volatility, with the dot com crash (2000), the largest recession in living memory (2009), then one of the longer bull markets in history (6 years from 2009 to 2015(?)). People have felt more financial volatility in the last decade than their parents were used to, although historically this type of greater market volatility is more “normal” market behaviour.

People have several ways to live life financially, and these are often based on modelled behaviour typically from their parents or mentors along the way.
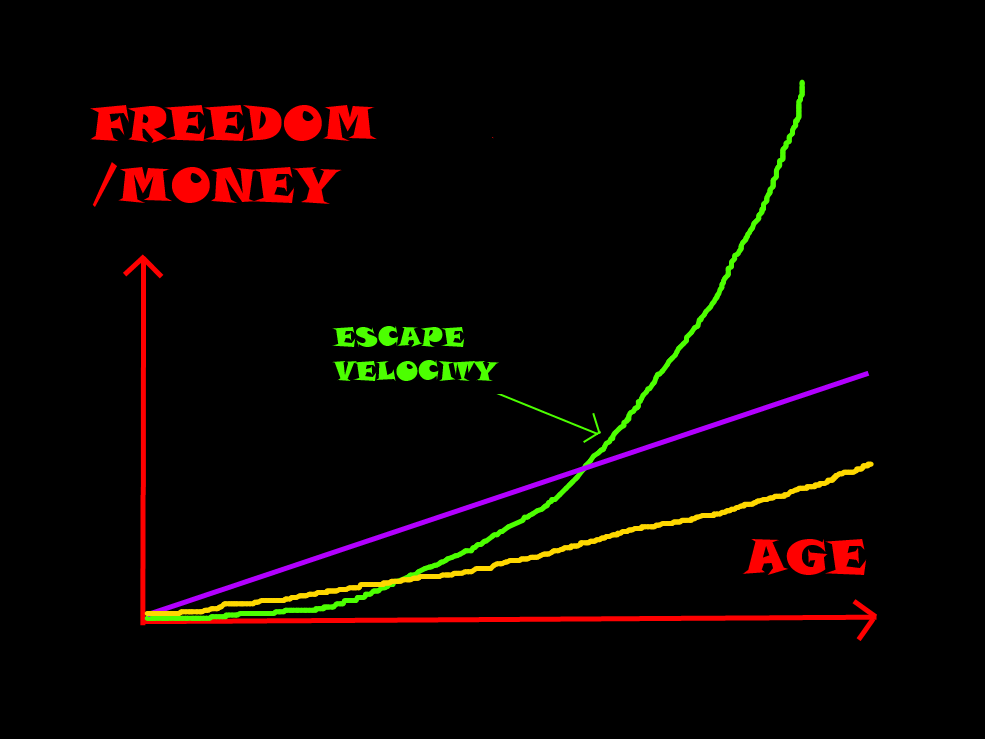
The following picture shows a few different trajectories for people’s shot at freedom:
Retirement - Financial Freedom Trajectory - 20160205
Purple line = many people’s perception of the american dream, that they think their financial progress should be relatively steady and linear. Potentially was their experience from watching people in their parents generation, “slow and steady wins the race”.

Yellow line = new reality of working and getting ahead, harder and harder with less rewards for more effort. Not sure why cant keep up with standard of living.

Green line = either an excellently paid professional OR an entrepreneur type starting a new business. Potentially (significantly) lower rewards in the early years, but hopefully with the curve increasing where the business starts operating under its own steam, eventually leading to “escape velocity” where the rewards for the effort are outstanding and non-linear and important owner self sustaining. The business owner doesnt not now have to invest as much time or money to run business, hence increased freedom as well as money. Curve can be much steeper if success comes faster.

So why this negative perception on “getting ahead” today ?
People perceive that they have to work harder and for less relative pay, which helps explain why today people think it is hard to get ahead, even if they have a very good job.
This is because the relative rewards are not there, which is mostly due to :
– Declining wage growth when compared to inflation, sometimes due to outsourcing, but sometimes due to processes getting more efficient or just being automated more effectively.
– Job commoditisation, especially for people who just slot into a role in a large corporation. There isn’t the incentive for the corporation to raise your pay significantly every year
– Less job security, careers can change or disappear with economic conditions, and less likely that people will do the same job for life.

This following table briefly compares different levels of jobs between our parents generation and today:

Career LevelCareer Rewards for Parents Generation Career Rewards today
Entry levelPoor rewardsVery poor rewards
GoodGood rewardsPoor rewards
Very goodVery good rewardsGood rewards
ExcellentVery good to excellent rewardsExcellent to potentially exponential outstanding rewards

We’d argue that today for the career categories from “poor” up to “very good”, on average people are receiving the rewards one level below what their parents generation got. However the big change is in the excellent category where the rewards are potentially expodentially better than their parents generation. However to these outstanding rewards require thinking outside of the standard career process. Arguably this is why people think they are suffering on their chosen career path IF they are looking for it to provide them with financial freedom; they are trying to make the current standard career with a company do what it cant do, make you wealthy.

That said, if you have an excellent job or start a business you can do potentially do very well, and become wealthy in a non linear way. Indeed for certain people like sports stars, CEOs and successful business startup owners, the rewards have never been greater. But they are for fewer and fewer people, because they typically require a level of excellence or hard work (and maybe luck) to achieve them. That is not to judge or call for wealth distribution, just recognise that you are not playing a linear game. Therefore on the lower rungs of the career ladder with a standard approach its hard to get ahead and seems “not fair”.

If you have an very good or excellent job (e.g. doctor, financial computer programmer, lawyer etc) but you probably are doing pretty well, but have a limit on how much you could make. But that might be more than enough for you, so although people say “you’ll never become wealthy working for someone else”, that is not necessarily true for everyone. However this time of jobs typically require great time and energy commitment, but because the rewards are there they are worthwhile – arguably still a “wage slave” but better to be a well paid one 🙂

How about doing both the day job and be an entrepreneur ?
Sometimes people split these career approaches into labels like “middle class” (standard track) or “runs own business” (entrepreneur track), but you are allowed to do pick and choose aspects from either approch that work for you – just try and fit it what you can around your current job.

For example, although we don’t like to admit it, many people’s personalities (including mine) can not deal with the constant (initial) failure associated with entrepreneur and keeping motivated when things go badly. If you know you don’t handle that well, the hybrid track standard/entrepreneur might be a good approach for some. Basically keep the day job as an income stream, but recognise that it will not make you rich on its own, but it is necessary to keep the lights on with a minimum of stress. Then take on side projects with ideas you care about. This can be good hybrid of the stability of the standard track, with the upside potential of the entrepreneur track. Plus you will always learn lots of stuff if you try to start your own venture or business.

In many ways there has never been more opportunity to take this “hybrid” track to learn or start a business part time. There is a massive amount of knowledge available online and even properly organised education classes (e.g. Khan academy). The tools are amazing and you can learn so much stuff for FREE just by researching without ever leaving the house! If you dedicated 5 hours a week to studying anything instead of watching Netflix that would be about 250 hours a year (or 6 weeks of study). The key that you have to want it, you have to want to do, be motivated, which includes working when you don’t want to. That’s not to say don’t make it just a task, but you have to overcome the initial urge to do not want to do it. It is useful not to push yourself beyond your breaking point of interest, because then sometimes you don’t come back to the work for several days, and you lose momentum.

So what ?
Basically recognise that a career and financial freedom is not linear. Also its ok to try the entrepreneur approach at the same time as the day job. If you are not interested in that then its fine to carry on – just don’t expect something from your career today that it might not be able to provide in the long run. If you are interested in trying new stuff, good luck to you and even if it does not work out you will learn a ton of stuff about yourself and how to run a business.