Category Archives: Crypto Currency

Bitcoin Fund Portfolio Rebalancing

This trade adjustment on European based Bitcoin fund SE:BITCOIN.XBT describes reducing bitcoin exposure inside a “speculative” trading IRA. The main reasons for selling the bitcoin fund are portfolio rebalancing, mitigating long term provider risk and high product expense fees.

Portfolio Rebalancing

This trade has been a multi year Bitcoin long, trading two Bitcoin tracker fund products GBTC and SE:BITCOIN.XBT. Both funds aim to track the Bitcoin price (BTC), and own a claim on underlying Bitcoin. For brevity the underlying Bitcoin owned by either fund will be referred to as the Net Asset Value (“NAV”). As a quick review GBTC is Grayscale’s well known investment trust whose price is tied to Bitcoin. The initial GBTC position was originally purchased in March 2017 with BTC at $1,250 – see initial trade entry for more background.

However in 2018 due to GBTC having a very high premium to the actual underlying bitcoin holdings (NAV), it became very unattractive as a long term holding. Therefore the entire GBTC position was replaced with a more obscure Bitcoin fund SE:BITCOIN.XBT traded in Swedish Krona on the Swedish stock exchange. The fund historically tracks the Bitcoin price much more accurately than GBTC with only a nominal premium to NAV. Bloomberg has average 52 week trailing NAV of -0.12% for SE:BITCOIN.XBT, but a whooping 18.22% for GBTC (as of Feb 4th 2021). Incredibly around year end 2017 and into 2018 the average 52 week trailing NAV premium was 53% for GBTC (on 16th Feb 2018) and occasionally spiked over 90%

GBTC was sold in Feb 2018 due to this huge premium to NAV – see the original trade exit for a detailed discussion. The final sale value contained NAV (the equivalent amount of Bitcoin held by the fund) and the premium (that the market assigned over fair market value for the Bitcoin held in the fund). The NAV amount was then reinvested into crypto with approximately two thirds in Bitcoin (SE:BITCOIN.XBT) and one third in Ethereum (SE:ETHEREUM.XBT). That maintained exactly the same amount of crypto holdings, but with some crypto diversification and greatly reduced exposure to fund premium. The premium part of the sale was “taking money off the table” and was invested into other portfolio assets. This crypto rebalancing trade was done at approximately BTC $10,025. All these trades were IRA eligible so rebalancing was not a taxable event. Rebalancing these XBT funds frequently would not be advised because of the wide trading spreads and international transaction fees. 

Fast forward 3 years to Jan 2021. Crypto prices have gone through a huge decline (a “crypto winter”) from about Dec 2017 to Dec 2018 – with BTC ultimately reaching a low of $3,300 around Dec 2018. Then came the recovery rally from Dec 2018 to Sept 2020 with BTC reclaiming $10,000. Following that Bitcoin has been on a rocket ship launch starting in Oct 2020 at approximately $10,600 about to a high in early Jan 2021 of $40,405. The latest boom is claimed to be institutional money buying in large tranches, chasing exposure for themselves or their clients.

In Feb 2018 felt like we hung around at the party too long, with BTC moving from a peak around $20,000 in Dec 2017 down to our rebalancing trade at $10,025. Were actually saved somewhat by being able to the capture the GBTC premium. So this time we decided to see if we can improve by selling near the top of a huge peak, not waiting for post peak decline (speculation of course). Therefore during decline from high in early Jan 2021, exited two thirds of Bitcoin SE:BITCOIN.XBT position on 20th Jan when BTC was approximately $35,105 (about 13% from peak a few days earlier).

Ethereum (SE:ETHEREUM.XBT) position was maintained with no reallocation. Even after allocation the speculative IRA portfolio still has 25% crypto exposure, of which approximately 60% is Bitcoin and 40% Ethereum. 

Provider Risk and Fees

Any crypto exchange traded product (such as GBTC or SE:BITCOIN.XBT) has some significant counterparty risk if held for several years. Fund could get hacked, the provider may lose private keys or have some other internal company disaster that impacts the underlying crypto holdings. There is also significant provider discretion about how to handle hard forks and how (or whether) they accrue that value back to fund holders. Bluntly there is a constant tail risk that one day investors lose some or all of their investment in a crypto fund (potentially overnight with no warning). Ironically holding these crypto funds puts a single point of failure back on to the provider – that the underlying crypto “trustless” philosophy was supposed to resolve.

Both crypto funds have very high management fees that mimic hedge fund style management fees. GBTC has 2.0% management fee (but higher NAV premium) and SE:BITCOIN.XBT management fee 2.5% (0.5% higher, but less NAV premium). Although crypto funds may be able to justify high fees due to the very specialized product, this has to be a long term holding concern – especially given industry trend towards much lower fees. As any crypto fund position size grows, the management fee becomes much more expensive annually in absolute real $ amounts. Investor alternatives to paying crypto funds management fees are managing their own crypto keys in cold storage. Cold storage approach has no management fee, but requires investor have a detailed crypto knowledge of potential multiple cryptos. An investor needs to balance no management fee in cold storage, with the possibility losing their investment due to their own mismanagement. Therefore the fund management fee is an expensive convenience fee to trade crypto on exchange, manage crypto in cold storage and implement security protocols.  

Investors can currently ignore high fees because crypto is currently trading on Fear Of Missing Out (FOMO) momentum – who cares about 2.5% fees when you make 300% plus per year? However through down markets over years or months, the fees begins chip away at long term value. The Nerdwallet Mutual Fund calculator can be used to compares product fees for an initial $10,000 investment in the (clearly hypothetical!) scenario where BTC price is static. Example shows that with no BTC price appreciation simply holding SE:BITCOIN.XBT with its 2.5% management fees loses nearly 12% in fees over 5 years – just for holding.

This clearly shows the impact of high management fees on long term holdings – these funds can only be held if high confidence crypto will rise. However as a medium term trading vehicle for crypto exposure with no taxable gains in an IRA, it is well worth these risks. Just remember to periodically take some off the table to mitigate the provider and management fee risks. 

Summary

GBTC and SE:BITCOIN.XBT products are a good trading proxies for crypto, but are still third party representations of a “promise to pay”. If you don’t have your own private keys, you don’t truly own your crypto. Crypto funds should not be relied on for multiple year long term buy and hold crypto exposure. Only crypto in cold storage does that. 

The crypto asset class is incredibly hard to hold without taking at least some money off the table on the highs. The peak to trough declines were about 85% for BTC and 94% for ETH from Dec 2017 peak to Dec 2018 trough. Unless some house money was already taken off the table in Feb 2018, it is doubtful that would have held all the way through “crypto winter” without finding the need to “do something”.

There is a reasonable chance that BTC goes significantly higher – however there are better asset classes that are less frothy starting from a lower base. BTC can potentially move from $35,000 to $100,000 from high (e.g. 200% return) but there are better opportunities to redeploy some of that crypto capital. Selling some for portfolio allocation is not the same as being bearish on crypto. This speculative IRA portfolio still has 25% crypto exposure, because it is the gift that keeps on giving. However if/when the crypto music stops, we will have made enough to construct an entire new portfolio from one single original Bitcoin position – whatever happens to BTC in future.


Bitcoin Halvening and Crypto as Money

Does a cryptocurrency need to represent a store of value to be successful over several years? One aspect of money is as a store of value. Value can be created by scarcity, that is literally limiting supply of any currency. Assuming there is more demand than supply for the currency, then it’s price should rise (becoming a store of value). By design many cryptocurrencies have built in scarcity because they will only create new coins on predictable supply curve.

Crypto as Money and Bitcoin Halvening - Bitcoin Split Photo - 20200507

Bitcoin Halvening image from this original photo under license

Bitcoin Halvening

One aspect of Bitcoin’s approach to this is the “Bitcoin Halvening” that occurs approximately every 4 years (every 210,000 blocks). On a specific Bitcoin Halvening date the amount of Bitcoin supply that can be awarded to a miner on each block is reduced by half. On average a miner can therefore except to receive half the amount of bitcoin for solving the same problem. After the Bitcoin Halvening date passes, this literally halves the supply of newly minted Bitcoin overnight. As a reminder the only way Bitcoin comes into existence is by being “mined”. Bitcoin mining is solving a complexity computer problem becomes progressively more difficult solve using existing computing hardware. If a bitcoin miner (a piece of computer hardware) solves the problem, they are entitled to keep a certain amount of bitcoin from latest block they solved. The scarcity comes from the fact that currently computing power is finite, so the “block solving” problem is hard to solve. If one miner’s computing power was somehow instantly improved by a huge magnitude for several months, then that miner would simply be able to mine the majority of available bitcoin. This is because the fast miner would be able to solve the computing problem before any other miners, so all other miners would not receive as many bitcoin rewards. Bitcoin scarcity therefore relies on finite computing power, essentially enforced by the current hardware speed.

Gold Cryptos

Both Bitcoin and Gold are a store of value because they are scarce. Bitcoin comes into existence via a computer hardware “mining” process, and is assigned market value because it takes lots of computing resources to create. Gold already exists in the ground, but becomes usable only after intensive exploration and physical mining operations. Gold is a hard to find metal that is first located through exploration. Gold then needs to be extracted with an energy intensive physical mining process to remove and refine the raw metal. Therefore Gold has value because it is hard to find and refine. With both Gold & Bitcoin the difficulty of their mining process helps maintain scarcity and is one reason that lets them act as a value store.

Recently there have been some new crypto tokens that have create a coin backed by real world assets. These “real asset” crypto tokens represent a true claim on a financial asset, not simply the tokenisation of a technology idea. For example PAX Gold is a very new product launched in Sept 2019 that combines advantages of blockchain and gold, with each PAXG token being backed by exactly 1oz gold. However “real asset” cryptos that represent a real world asset still come down to one word – trust. The entire system hinges on trust, specifically that you can provable verify that 1oz of gold in a London vault is actually really represented by the 1 token in your wallet. If you can have trust in the company auditing, it can be a very innovative way to store wealth on the blockchain.

Crypto Sectors

Bitcoin has been alive for over a decade, and many other crypto coins have been around for five years or more. “Long term” is relative – in crypto it is probably any coin or token that has been alive for more than five years. Widespread adoption is both a critical measure of success for a crypto to be considered currency like “medium of exchange”. Currently those who believe in Bitcoin Maximalism appear to have an edge as first mover in the currency space, as Bitcoin has the largest payment adoption and approximately 65% dominance of all crypto market cap in April 2020.

Crypto is notoriously hard to place into neat boxes. However if there is such as thing as crypto “sectors”, then some candidates would be “currency”, “privacy”, “tokenisation platforms”, “real assets” and “utility coins/tokens”. In currency, privacy and tokenisation platforms “sectors” there is nearly always the first mover that the advantage. For example Bitcoin (BTC) is considered the primary currency coin, Monero (XMR) the first mover for privacy and Etheruem (ETH) the first token platform. However due to the huge array of use cases it is hard to define one single “winner” from all the utility tokens/coins.

As a very general observation in 2020, currently crypto projects that act as money or enable tokenisation seem to be the main winners. Crypto needs to either be used as a store of value, be asset backed or provide a tokenisation platform (the plumbing) to allow the value tokenisations to occur. Crypto projects that only rely on a technology or business idea to “create value” do not appear to gain market cap long term, even if the project is succeeding with its technical objectives. Many crypto projects are finding it hard to build their own ecosystem, because investors tend to get focused on a few winning projects, while the rest die. Essentially there a few categories of use cases, with winner take all in each one. The losers die off slowly over several months and years. This is not necessarily because a project “failed” from a technical perspective, just that it failed to consistently attractive new capital to justify a higher price.
Increasingly crypto that have highest market capitalisation are maturing into money (for exchange), a real asset (that has real world value outside of crypto) or the tech platform that enables tokenisation. The next wave of cryptos with long term staying power could to be tokenising financial “real assets” in the real world, not simply to tokenise a whitepaper idea.

Below are some “sector” examples. Nearly all of the top 20 coins are currency, privacy or token platforms. There are few true utility coins/tokens with larger market caps, but some interesting use case projects are listed below. These are not exhaustive list, just an overview. For reference, here is the latest and greatest CoinMarketCap ranking list.

Currency : Bitcoin (BTC), Ripple (XRP), Litecoin (LTC), Decred (DCR)
Privacy: Monero (XMR), PIVX (PIVX), AEON (AEON)
Real Asset : Tether (USDT – USD stable coin), Pax Gold (PAXG – physical gold)
Token platform : Ethereum (ETH), EOS (EOS), Texos (XTZ), Neo (NEO)
Utility coins/tokens: Salt (SALT – Crypto Lending), Filecoin (FIL – Storage), Golem (GNT – Distributed Computing)

Crypto as Money

Currency and privacy are related aspects of money. Sometimes there is a somewhat artificial distinction made between “currency” coins that function as “money” and “privacy” coins do “private transactions”. However surely two main requirements of money are both privacy and fungibility? Cash banknotes traditionally have a high degree of privacy, even though they are sometimes tracked by law enforcement by serial numbers. Generally each banknote is interchangeable with another – one banknote of the same amount can be exchanged by two parties for another banknote with the amount. The specific banknote itself is not important, just the exact value it represents.

Confidence in the liquidity and fungibility of any currency is a crucial factor enabling adoption. However Bitcoin is clearly NOT fungible. Indeed any crypto “currency” coin (not just Bitcoin) with publicly visible blockchains allows positions and transactions on coin addresses to become fully traceable with more advanced analytics. As long as you can identifier a natural person (owner) of a bitcoin address via some method, you can see every transaction they make on the blockchain and their current address balance. This would be equivalent to your bank publicly showing on their website, all of their customers transactions and month end balances – just without any personally identifiable information. An alternative way to think about this, would be if every banknote in the world had a public list of every transaction it has ever been used in since it was created (just without the name of the from and to parties involved in the transaction). It is doubtful if consumer privacy advocates or customers would accept this with a “real world” bank.

This everyday reality for Bitcoin or any other publicly visible blockchain is becoming problem. It means that individual Bitcoins have a full history. If you can piece together all the owners of the addresses via social engineering or know your customer rules, then all of Bitcoins anonymity disappears. For example, most crypto exchanges (and any “on ramp” into the cryptosphere) require a large know your customer regulations (e.g. driving license, passport, proof of address etc).

This blockchain forensics is a problem because it basically breaks the fungibility of Bitcoin. This analysis allows identifying “good” bitcoins that have never been used for any thing questionable, and “bad” bitcoins that have (perhaps unwittingly) had some criminal use. For example, assume you open a small business selling coffee that can legitimating accept Bitcoin payments. If a dubious actor decides to use their “bad” bitcoin to buy your coffee, your legitimate coffee selling business could have it’s crypto exchange or bank accounts shutdown for dealing with a “bad” actor. This could occur even if the majority of your business was with “good” bitcoin. The issue is that the “good” and “bad” bitcoin decisions are not decided by yourself, they are decided by the crypto institutions (e.g. exchanges) you signed up with.
The “real world” cash equivalent would be something like being banned from your local coffee shop, because you used a bank note previously involved in a historical crime committed by different person.

Monero (XMR) is the only privacy coin to fully resolve this fungibilty issue by design. There are many technical features that ensure Monero fungibilty, but two features to highlight are 1) not having publicly viewable transactions on a blockchain and 2) having read only view keys.

Monero less transparent blockchain, where the specific transaction history of a coin cannot be viewed. Therefore 1 XMR will always be the same another 1 XMR – it doesn’t matter how the individual coin has been previously used. Monero is much more similar to cash (banknotes) because it is untraceable, whereas Bitcoin is trackable digital money.

As transactions are not viewable on Monero blockchain there needs to be some way for other parties to be able to verify holdings without controlling them. With Bitcoin the public blockchain does this because you can send anyone an address to look up. Monero has the concept of view keys give the ability to prove address balance to only interested parties (not the entire world).

Some other cryptos do have privacy features, but typically they are not enabled by default. Typically a privacy feature has to be “turned on” for a specific transaction. Some coins are therefore “private” (privacy enabled) and “public” (default), so these coins are by definition “different”. Therefore even in the same crypto coin since the “private” coins are not viewable on the public blockchain, as they are not identical to “public” coins. This means that coins are not truly fungible even within the same crypto. Monero is private on the actual protocol level with the option to be transparent, whereas with Bitcoin every transactions will by definition only every be “psuedo anonymous” because of the publicly viewable blockchain. Monero (XMR) is unique because the idea of privacy is built in by design.

If you are interested in learning more we have written an Amazon Kindle eBook Better than Bitcoin – A Beginners Guide to investing in Monero.

COVID-19 Coronavirus Portfolio

This is a COVID-19 coronavirus portfolio of trading ideas generated in the last two months. The portfolio aim is to identify and invest in new trends in commodities or sector ETFs generated by either government policy monetary policy response or “shelter in place” lockdowns.
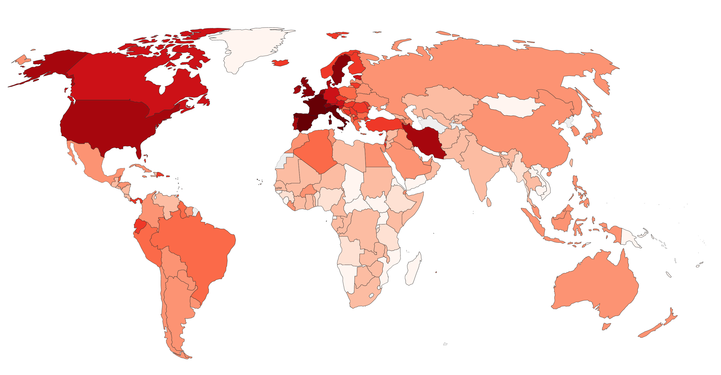
Covid-19 coronavirus portfolio - world map - 20200416

This collection of trading ideas was setup somewhat quickly as a tactical portfolio in response to the COVID-19 Corona Virus situation. The fundamental portfolio theme is that the market has been almost instantly split into winners and losers, Some industries have simply been decimated overnight that they can’t function as viable businesses for the immediate future. For example, even Warren Buffet completely sold all Berkshire Hathaway’s US airlines in April 2020. The aim of this tactical portfolio is to think about trading ideas that can generate winners in the “new normal”.

COVID-19 coronavirus portfolio – Option Volatility

Volatility is very high in most commodities and sectors, so it is critical to use option trading strategies for high volatility environments. Specifically Implied Volatility Rank (IVR) is in the range of 75% to 100% for many ETFs this month. Simple one leg option strategies such as buying out of the money calls in high volatility products will likely not do well. The “go to” trade on ETF options has typically been to buy long dated deep in the calls (LEAPs greater than 9 months out). This means that the majority of premium paid is intrinsic not extrinsic (time) value – the extrinsic value will likely reduce over the course of several months as the current volatility premium likely goes lower. To help with any downside, call spread overwriting and put butterflies on the same ETFs. There was also call spread overwriting in major tech indexes to hedge some downside in tech ETFs that do not have any options. Where no ETF options were available, actual ETF equity positions were taken, but sized appropriately at less than 10% of portfolio size.

COVID-19 coronavirus portfolio – Trade Ideas

The exact thinking behind the ideas need more detailed separate blog posts to fully justify their inclusion. However this tactical portfolio blog post is just to give the trade ideas, their high level implementation and any hedging strategy. This following ideas show the sector, idea rating (buy/hold/sell), the conviction level (low/medium/high) and a high level idea description.

New trades with “Buy” where started in the last 45 days. If a “Hold” is included in this portfolio that means it was already owned, but think performance would improve because of COVID-19 Corona Virus environment. The aim would be to hold most of these for 2020, or until stopped out.

Each paragraph describes a trade idea within a sector (including trade direction), rating (Buy/Hold/Sell) and overall conviction level.

Real Estate and Liquidity

Real Estate (Long). Hold/Buy. Medium. Select international opportunities mostly due to strong USD creating weaker local currencies and lower prices on local real estate. Here “local” means local to a target country in question, specifically Canada and UK whose currencies have been beaten up quite a bit due to flight to safety buying of USD. Keeping liquid in USD to maybe a currency conversion later in 2020 for a property purchase. Not rushing into anything. Actively writing a new Ebook for US investors on future opportunities with international real estate in 2020 and beyond.

Metals

Gold (Long). Buy. High. Gold is one of the best performing assets YTD in USD, and rebounded very quickly with after an initial March 2020 sell offs. The rebound was a direct response to the FED stimulus packages for the general economy. Gold is trading at 7 year highs in USD (near $1700) but importantly gold has made already made new all time highs in just about every other major currency such as Euro, UK Pounds, Canadian Dollars (etc). Select currency and 20 years on this Bullion Vault to chart historical gold price in each currency. Bought deep in the money calls on physical gold ETF (GLD) with an approximately 90 delta for Jan 2022. Aim is maintain a gold position, to ultimately replace with some actual physical gold, when the current spot to physical price premium subside. Aside from just the physical metal, gold miners should benefit from lower oil prices and therefore have reduced input costs, that should increase earnings per share in 2020 and beyond. Gold miners are up about 30% since purchase of Jan 2021 deep in the money calls in both major (GDX) and juniors (GDXJ). These are potentially multi year longs.

Silver (Long). Buy. High. The gold/silver ratio is at about 113 which means that silver is historically very undervalued compared to gold. Interestingly the silver price is approximately tracked the Dow (DIA) year to date, being down about 15% – so it does have more of an industrial market supply and demand component. Gold tends to function as a true safe haven, but silver can influenced by industrial supply and demand from economic conditions. Silver can definitely sell off in a general market downturn, where as gold is holding its value better. However if there is to be a significant gold bull market, silver will tag along for the ride, but may take more time to turn around. Trade was bought physical silver and silver metal (SLV). Bought deep in the money calls with an approximately 85 delta for Jan 2021.

Uranium mining stocks (Long). Potental new uranium bull market for 2020s. Uranium producers and explorer stocks have been one of best performing sector and are up YTD – beating general indexes. Uranium equity could definitely get caught in a wide market downtown, but has tracked higher physical uranium prices that have increased from low $20 to $32 in last month. Ideally this is a very specific sector mining play that should be a play on the physical price of uranium, and should not be correlated to the general market. We play this with a small position in a very small ($4 million market cap!) and brand new ETF of uranium producers URNM. This could be a multi year trade, but the risk reward setup seems good.

Energy

Oil drillers (Long, short vol). Buy. High. Added new full size positions in OIH. Made bullish call last month on OIH was trading at around $4. In OIH sold cash secured $3 puts in July 2020 and Sept 2020, because the implied volatiliy was insane (over 100%), and combined with half a position in long OIH stock. This position bounced nicely, so bought back the short puts for good profit, then hedged the remaining stock with a wide put bufferfly in July 2020. Sold 40% out of the money call in July 2020 to help finance the put butterfly a bit. This is neutral to long ish bias on OIH until July, but it has run up a lot in April so it is sells off in May (seems likely to take a break) then the put buttefly will make some good money, even if the OIH stock loses money. Note that OIH has had a 20:1 reverse split this month, so the $ option strikes mentioned above will need to be multipled by 20 to compare to a current OIH chart.

Oil explorers (Long, short vol). Buy. High. Added new full size position last month on XOP (same timing as OIH trade). Bought a deep in the money for Jan 2021, then overwrite with call spread for May 2020. The call spread recently had both legs in the money and was only 2 weeks to go to expiration. Therefore overwritten call spread was rolled to Jun 2020 for a minor debt. The aim is to maintain the deep in the money Jan 2021 call, and keep overwriting for the rest of the year. If XOP goes up a lot we will capture majority of move. If stays same we can get some income from the high volatility in the call spreads (if they expire worthless). If goes down we will lose, but much less than stock. One advantage is if XOP price goes down fast the implied volality will go up, and so the deep in the money call will stay bid. Note that XOP has had a 4:1 reverse split this month, so the $ option strikes mentioned above will need to be multipled by 4 to compare to a current XOP chart.

Natural Gas (Slightly long, short vol). Hold. Medium. The natural gas etf (UNG) is hard to hold long stock for several months, due to the current contango in natural gas futures. Contango is when near month natural gas futures trade lower than far month future prices. (UNG) maintains its natural gas price exposure by constantly rolling contracts – specifically buying more expensive far month futures contracts, by selling the expiring (and cheaper) near month contract. This enforced rolling built into the product, creates a long term drag on prices while natural gas is in contango (look at any multi year chart of UNG). This is a less extreme version of the same problem with USO contango this week – when the oil price went negative (!). Since owning (UNG) stock is not a good idea, the setup is usually buy a long term calendar call spread, and also selling near dated call spreads on (UNG). This takes advantage of high implied volatility with limited risk, but can still benefit if prices are higher or neutral. This does sacrifice large profits if (UNG) spikes higher quickly and cannot roll fast enough into the price increase.

Natural Gas Producers (Long). Buy. Medium. US natural gas equities have been beaten up in 2020. Clearly there are is a huge over supply of natural gas and a massive worldwide demand shock for energy. (FCG) tracks an equal-weighted index of US companies that derive a substantial portion of their revenue from the exploration & production of natural gas. Approximately 15% of its portfolio is in MLPs and the remaining 85% to equities. Interestingly the (FCG) attempts to recovers some of its 0.6% management fee by securities lending, and it does have a dividend yield but that will likely disappear to much smaller amount in 2020. However to place this in some historical context, many US natural gas equities are trading at the lowest price for 20 years. For example, buying natural gas producers index (FCG) for $5.50, when its all time high is about $155 in July 2008. The US natural gas producers sector at these prices is low enough to be a binary trade. Either the majority of the US energy complex is going bankrupt and this is a slow grind lower for many years (“lose”). Alternatively some energy demand returns, the survivors consolidate and a restructured sector operates at higher price levels at some point in the next few years (“win”).

Equity

Cloud Computing (Long). Buy. Medium. More e-business activity (e.g. Shopify) for starting new businesses and tools for people working for home. This is long equity ETF but focusing on cloud technology (CLOU). Actively trying to ignore struggling parts of economy (e.g. airlines, manufacturing, automative, consumer financing etc). Positions in CLOU and other tech ETFs will be actively hedged with QQQ OTM call spreads.

Mortgage REITs (Long). Buy. Medium. MReits were trading at significant discounts to book value in April 2020 This was definitely a speculative buy with high yields around 11%, especially because dividends could be heavily reduced in next year. However if MReits can simply maintain their value, and allowed to DRIP for a number of years (even at these levels), then they can add some welcome yield and maybe some capital appreciation. MReit ETF (MORT) is a high yield trade great for a portfolio position in an IRA, because it can be allowed to DRIP long term. This is relatively risky play, and only medium conviction. There is no simple way to hedge this using options, so will only take a half position size to manage the risk.

Solar ETF (Neutral). Sold. Medium. Fortunate enough to sell Solar ETF (TAN) around $34 after the bounce back up to $37 in early March 2020 (not the top, but about 20% off the high the way down). This was a risk off trade, which preserved some capital initiate some of the other new ideas in this portfolio.

Emerging Market Equity (Short). Buy. High. Emerging market companies that have debt denominated could have a hard time paying it back, with economic shutdown and currencies depreciating against USD. Emerging market equity like Brazil (EWZ), Mexico (EWW) and India (INDA) have not bounced back as fast as the main US equity markets. For example Brazil has traded in an approximate range of $21 to $26 over last month, down from a Feb 2020 peak of (this is a “L” market chart, not the “V” market chart). Two trades here were 1) out of the money Long Put EWZ butterfly in May 2020, fully financed with short call spread on India market (INDA). This was neutral to bearish. 2) in the money Long Put EWZ butterfly in May 2020 for a debit, and no short call spread. This was more bearish. Brazil equity market has proven to be weaken than India in April 2020 so that seems like a good trade choice approaching May 15th 2020 expiration. INDA trade should expire worthless. Brazil trade already in the money and likely to still be there closer to expiration.

High Yield Corporate Debt (Short). Buy. High, now Medium. Corporate credit quality is being impacted by an unknown amount due to corona virus shutdowns, so that uncertainty would cause high yield corporate bond ETFs to trade significantly lower in the next couple of months. Entered an in the money (ITM) put butterfly as a limited risk reward way to short high yield bond ETF (HYG) on 17th March. HYG was at about $77 then went down 10% in a hurry to around $70. The risk was managed with the limited risk trade structure of an ITM put butterfly, but still got “taken to the cleaners” by the announcement that the FED would be buying junk corporate bonds. This policy announcement caused a huge HYG rally in April from about $70 to $80. Unless there are signs a sharp move down in high yield this week, it will be closed this week approximately 10 days before 15th May expiration – losing about two thirds of original trade capital this week. This is to preserve one third of the remaining principal from a losing trade, as a put butterfly that is now out of the money will decay much faster into expiration. A classic example of a good initially profitable good trade entered for the right reasons, but taken out by unprecedented policy decision. Trade was a loser, but have successfully managed the short risk by not having an unlimited short risk trade on.

Crypto

Cryptocurrency (Long). Hold. High. Bitcoin (BTC) and other alt coins (e.g. XMR). Holding not adding any more.

Liquidity and Hedging

Peer to peer lending – Lending Club (Neutral). Sell/Hold. High. Already dialed back risk here several years ago due to lending club management issues. However this month turned off auto re-investment of cash into new notes. Definitely do not want any more exposure to consumer credit for next year or so. Peer to peer is a small position, but turning off re-investment seems prudent until can figure out what is going with the general consumer lending (does not look good in short or medium term).

Cash (Long). High. Long USD for investment opportunities and saving up to get properties with low LTV. On existing international property businesses we are looking to open small home equity line of credits on properties with low LTVs in local currency (assuming local bank allows it). A small amount of debt exposure in local currency is effectively a long USD position (since we are based in USD). If the local currency for a country where we own property declines significantly we may consider paying down mortgage principal from USD cash.

Hedges (short, combined with underlying positions). Buy. High. Index call spreads overwriting out about 2 months. similar idea to covered covered calls, but with limited risk reward so that if the market does go massively higher are not losing so much (and can probably roll out of it in following months). Selectively combining put butterflies with hedges.

COVID-19 coronavirus portfolio – Summary

This tactical portfolio was created relatively quickly. The main themes were long metals and energy, with some technology and potentially some real estate later in the year. There are also some relatively aggressive hedging and other complimentary short positions. This is a long/short portfolio, that would be much more heavily hedged if world goes “risk off” again. Having good entry points in April 2020 should definitely help holding positions for longer term. The other main theme is keeping very liquid and not over allocating to make sure money is available for opportunities. In summary, only trade if you want to, not because you have to.

Exiting Bitcoin Investment Trust due to Premium

This trade exit on GBTC describes how exiting Bitcoin Investment Trust due to premium was decided. The original GBTC position was purchased in March 2017. To recap the GBTC is an investment trust whose price is tied to bitcoin. The historically high premium to the actual underlying bitcoin price is the main reasoning for selling our GBTC position and replacing it with bitcoin and etheruem products that can replicate similar exposure (without that premium). This trade was IRA eligible so there was no issue of paying extra capital gains by selling after 11 months (instead of waiting for 12 months for long term capital gains to kick in).

Exiting Bitcoin Investment Trust due to Premium

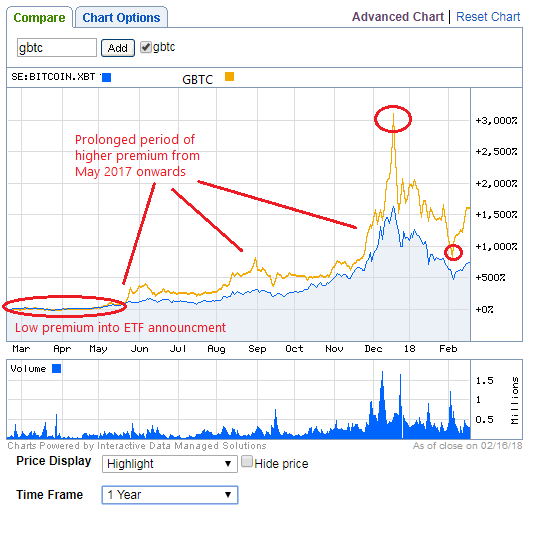
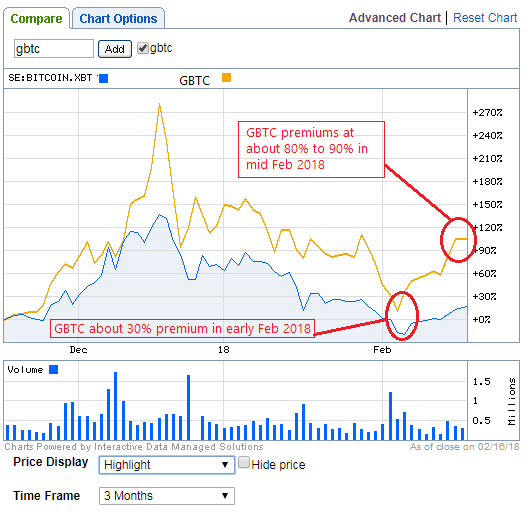
The charts below compares an European based Bitcoin fund SE:BITCOIN.XBT (as a proxy for Bitcoin spot price) with GBTC. This clearly shows that throughout 2017 people have been prepared to pay a huge premium to own bitcoin in their US based brokerage account.

GBTC Feb 2018 1 year trailing premium
Bitcoin Investment Trust GBTC Trade Exit - Feb 2018 1 year trailing premium - 20180215

GBTC Feb 2018 3 month trailing premium
Bitcoin Investment Trust GBTC Trade Exit - Feb 2018 3 month trailing premium - 20180215

Combined with bullish Bitcoin 2017 price action and inflated premium, the GBTC price has moved up strongly. The above charts and Bloomberg show how the GBTC premium has moved for the last 12 months in a trading range of 50% to 120%. In only the last 3 months the GBTC premium has been as high as 120% in Dec 2017 and low as 30% in early Feb 2018. The premium trades aggressively higher on rallies and lower on sell offs. This behaviour has the effect of amplifying trading extremes, but increasingly makes it a less reliable buy and hold product.

As a recap, when the trade was entered in March 2017 GBTC premium had shrunk down to about 8% because there was the belief that a new Winklevoss Twins bitcoin ETF was about to be allowed by SEC. Once that was announcement was negative, the GBTC premium returned with a vengeance.

According to Bloomberg the average trailing 12 month GBTC premium was 53% (on 16th Feb 2017). By comparison the Bitcoin tracker fund premium was 0.08%. Additionally there is a 2.0% management fee associated with GBTC which is used to help manage the cold storage and security of the underlying bitcoin asset – so any premium paid on the actual GBTC spot price would seem to be excessive. The Bitcoin tracker fund management fee is 2.5% (higher) but since it trades at only 0.08% premium to NAV it is a relative “bargain”.

On 16th Feb 2017 GBTC had a 1 year performance return of 1,574.75% that more than double the Bitcoin tracker fund 1 year return of 774.33%. This is amazing given that the stated aim of the products is identical – the GBTC out performance results are exclusively due to premium.

For reference here are the Bitcoin and Ethereum products available that trade in Europe but can be traded in a US based brokerage account. These products do not have a huge premium to spot bitcoin and are IRA eligible. Bizarrely the swedish Krona product has the higher volume, over the Euro based product. All of these fund products introduce some currency risk exposure, but that is likely less to be way less variable than the GBTC premium risk.

CoinCurrencyInfo
Bitcoin Swedish KronaCOINXBT:SS
Bitcoin EuroCOINXBE:SS
Ethereum Swedish KronaCOINXBE:SS
EthereumEuroCOINETHE:SS

A Good Trade but Poorly Traded

This GBTC trade was ultimately a great investment, but one that was traded frustratingly poorly.

A small tranche was sold in May 2017 to cover the risk on the original position and the rest was left to run as “house money”. Clearly with hindsight that was the “wrong” thing to do, but is it good risk management on a very volatile product – and allows staying in the trade for a much longer amount of time. This risk management part was not poor trading, but the management of the resulting price action in 2017 can be improved – as discussed below.

The final run up into Dec 2017 was not well traded, and therefore missed the significant peak at $39, and survived the drop to $10 in Feb 2017, so decided to exit with some value still intact at $18. This is a very hard trade to take psychologically because of the anchoring to the high point at $39. However the 1300% returns in less than a year is still amazing, yet disappointing from a trading perspective. The split adjusted entry point was $1.44 so clearly this was all “house money” but some exit trading at higher prices should have been achieved into the Dec 2017 peak. This is not purely hindsight – it was clear the short term nature of the blow off top, even during Dec 2017. This does not mean the end of the bitcoin “bubble” – just a medium term trading top that should have been taken advantage of.

Bitcoin Investment Trust premium – Trade Exit

GBTC premium expands on rallies (up to 120% in Dec 2017) and contracts on huge sell offs (down to 30% in early Feb 2017). On trade exit at about $18 that is approximately an average 80% premium, which is somewhere in the middle of the range extremes for the last year. On trade exit with bitcoin at approximately $10k, the book value (or NAV) of GBTC was about $10, therefore there is approximately $8 of premium to nav (or about 80%). Therefore about 1800 shares of GBTC buys approximately one bitcoin, but the book value is about 1000 shares. Clearly there is a convenience premium, but 80% over book value is very high. That does not mean GBTC price cannot rise further, or the premium increase more in 2018. However if the premium ever shrinks to say 30% then it is quite possible to lose money in GBTC even if the bitcoin price goes up. When you buy GBTC at $18 about 45% of your purchase is premium (or “fluff”) over the price of the underlying bitcoin. That is a very hefty premium to spot.

Trade Entry was at GBTC split adjusted $1.44 (actual pre split price at that time was $131) in March 2017 when bitcoin was approximately $1250. Trade exit was $17.96 when bitcoin was about $10025 in Feb 2018.

Trade Replacement

The GBTC investment can be replicated without premium using the Bitcoin tracker funds. Since 1000 shares of GBTC represents approximately 1 Bitcoin, these trading approaches could be taken:

1. Sell 1000 shares of GBTC ($18,000 USD) and purchase $10k Bitcoin tracker fund – this maintains exactly 1 Bitcoin exposure. The remaining $8000 premium can be maintained as cash for future purchases if there is a pull back or for other investments. This maintains bitcoin only exposure.

2. Sell 1000 GBTC then purchase $10k Bitcoin tracker fund and $8k Etheruem tracker fund. This gives exactly 1 Bitcoin exposure but allows using the GBTC premium to buy a new Etheruem position. This has created a slightly more diversified crypto portfolio – but still fully invested in crypto, with no cash on hand.

3. Sell 1000 GBTC then purchase $6k Bitcoin tracker, $6 Etheruem, and keep $6k cash. This gives a less aggressive portfolio because it keeps some cash on hand in case of a pull back.

4. Sell GBTC and maintain cash to wait for a big pullback to invest. If you are a believer in the long term crypto currency bull, this is arguably the biggest opportunity risk – crypto prices are hard to predict and can be notoriously bubbly – so it having exited once at lower prices it is hard to reestablish at significantly higher prices.

These reallocation strategies are all tax optimal in an IRA.

Summary

There is a significant chance that if there is a bullish BTC price march in 2018 towards $20k again then GBTC will do very well. Indeed one day later BTC is already trading 10% higher at $11,000 (so clearly this is proving a badly timed exit). However there need to be discipline to recognize when that the GBTC trade now has premium risk outside of just Bitcoin spot price risk. That risk can be resolved by selling GBTC and buying bitcoin tracker funds.

This is not necessarily a price extreme for bitcoin, but a potentially a premium extreme in GBTC. Still bullish on bitcoin and crypto assets for the next few years, however GBTC may not prove to be a good long term buy and hold product (due to the premium).

In summary this is not purely a bitcoin play, but has become a play on the premium investors are prepared to assign for the convenience of exchange traded bitcoin product. Importantly selling GBTC is a not a bearish call on bitcoin or crypto in general, just trying to avoid being the last one out when playing musical chairs with the premium trade.

Bitcoin Investment Trust Premium

This is a bitcoin investment trust premium idea from seekingalpha.com we have taken a position in last Friday.

Investment Setup

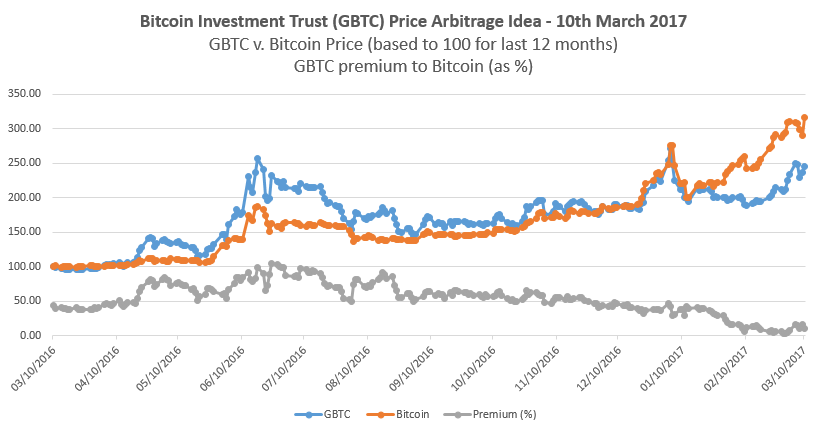
GBTC is an investment trust whose price is tied to bitcoin, with an extreme caveat that historically it has traded as sometimes astronomical premiums to the actual bitcoin price. The chart below clearly shows people have been prepared to pay a huge premium to own bitcoin in their brokerage account.

Bitcoin Investment Trust GBTC Price Arbitrage Idea - 20170310

The chart is not easily available online. It had to be created manually by downloading the time series for GBTC prices and bitcoin prices, then working out the “premium other NAV” between them. When this was done both the GBTC & bitcoin prices were indexed back to 100, and the “premium over NAV” was plotted on the same Excel chart. Note that each individual GBTC share represents 0.09336483 of a Bitcoin (BTC) – so that ratio need to be accounted for when calculating the premium.

These are some highlights from the chart:
– GBTC premium to bitcoin price has been as high as 100% down to 5% in last 12 months
– GBTC was trading at a significant premium (70% to 100% range) to actual bitcoin price in June/July 2016
– GBTC is now only trading as about a 5% to 10% to bitcoin price in March 2017
– This premium has trended lower in last 2 months in anticipation of new Winklevoss bitcoin ETF (COIN) getting SEC approval.

Short Term Investment Thesis

– If bitcoin ETF (COIN) is approved, then this premium should be reduced further – but GBTC price will rise due to bitcoin price
– If bitcoin ETF (COIN) is not approved, then premium should revert to 30% range & GBTC price should increase to reflect that
Absent a huge bitcoin crash this should be a winning scenario in either case

Medium Term Investment Thesis

– Bitcoin is stable above $1000 for 2017
– Historical 30% premium to bitcoin price is restored, because there is no longer a viable pending Bitcoin ETF that would compete with GBTC.
– GBTC has applied to be listed on the NYSEARCA which is pending a decision by Oct 2017. It currently trades on OCTBB and if it moves off the bulletin board this should improve product liquidity and investor access. GBTC premium might trend up in anticipation of this a few months out from the announcement (something to watch).

Bitcoin Investment Trust premium – Trade Entry

Trade Entry was at GBTC $131 on Friday when bitcoin was approximately $1250. Trade exit would be when a the premium is restored to typical range greater than 30% – but we have to wait 30 days to exit due to 30 day rule.

Is lending crypto currency safe?

Excitingly it is now possible to lend out your Monero and other crypto currencies to other investors. Crypto currency lending is a bit like peer to peer lending for crypto, but the lending purpose is exclusively for other customers margin requirements (so not diversified). Lending crypto currency needs to be done via a crypto currency exchange where your currency is loaned to other exchange customers so that they can establish short or margin long crypto currency trading positions. This article chiefly considers lending out Monero (XMR), but the principal applies to any other crypto currency that allows exchange lending.

lending crypto currency

As an investor annual rates of return on any individual loan have ranged from 3% to over 100%. The rates on exchanges are typically quoted in daily returns, so a daily rate of 0.009% is approximately 3% – you can easily use any online calculators to convert any daily rate to an annual rate. An example annual to daily interest rate calculator is here (no affiliation).

We use Poloneix for lending, and find it gives good liquidity and relatively simple trading interface and order book. There are other platforms like Bitfinex but haven’t used them for lending.

As of October 2016 to our knowledge, no one has ever lost significant money lending Monero (or any crypto currency) on poloniex or other exchanges (so far). However before you go “all in” there are some significant risks to be aware of. The attractive returns are not just a free lunch. Here are some basic risks…

Margin risk

The main issue with exchange lending is it assumes that the exchanges algorithm for exiting customers out of their margined positions will not result in major loss. Essentially when lending on the exchange, your xmr is loaned to other exchange customers so that they can establish short or margin long positions. As usual for margin trading the exchange requires some capital level to be maintained in a customers exchange account, for the duration of their short or margin trade. If the crypto currency market moves against the customers positions and they no longer have the margin capital required to maintain their position, then the position will be exited by the exchange. This will likely be at a sizable customer loss. The theory is that the exchange has modeled the maximum likely amount capital required across ALL customers to meet an extreme move.

In theory the crazy moves should occur rarely and the exchange should be able to control any loses by forcing customers to liquidate their positions in real time. Basically they can take out multiple customers over their margin limit, but in theory not all customers at the same time should be affected (in theory!). However in practice these huge moves tend to happen more frequently than the statistics would predict. A good recent real life example is when the Swiss franc move meant several foreign exchange (FX) trading firms had to eat a few million of customer losses. This was in the FX currency market, but the principal could easily apply to crypto currency lending. Therefore you are depending on your exchange to have well executed customer margin requirements and forced trading position liquidation strategy.

Platform risk

Exchange lending and indeed storing any crypto currency on any exchange is subject to platform risk. That is the risk that the actual exchange platform fails and you lose some or all of your crypto currency balance. This could occur through hacking of poor exchange security or even an issue with the particular crypto protocol that can be exploited. Basically there is a slight possibility that your coin on an exchange just disappears overnight. You can obviously reduce hacking risk on your individual account by using website security features like two factor authentication. However that doesn’t guard against back door hacking exploits at the exchange level. You should probably keep no more than 20% of your entire stash with one website, and even possibly budget for 20% of it disappearing every 3 years! For example, storage solutions for monero are to maintain a cold storage (off exchange wallet) under your control. That requires significant technical know how to setup, but is likely worth it to maintain your stash securely.

If you don’t think that exchange default can happen look at the historical hacks on mtgox Bitcoin (March 2014) and bitfinex (August 2016).

Important takeaways highlight these two possibilities storing your coin on exchanges:
– total loss: many mtgox investors lost all their bitcoins
– partial loss: Bitfinex distributed the losses against all customer balances irrespective of cash or coin.

The Bitfinex partial loss example has an interesting piece of moral hazard. Note that even though only Bitcoins got hacked, ALL the OTHER coin balances on your reduced by 36% and were replaced with an exchange IOU! Essentially you were exposed to Bitcoin security flaws even if you had zero Bitcoin balance – which seems somewhat logically unfair. The point is that you could be exposed to balance loss for any coin on an exchange – even you did not think you were.

Is lending crypto currency safe?

The non bitcoin crypto lending market is typically less than 2 years old for most coins. Lending crypto currency on any exchange may mean that there may technology glitches (eg unable to liquidate as required) or lack of volume (eg not able to lend out all the currency you wish to, because there are not enough people to lend to). However we have tried this though and have been able to lend out several thousand XMR for about a week relatively easily. The % return is potentially good for the risk, typically earning about 5% to 15% annualised on average – even if you have some loans in the 15% to 100% range – typically it is hard to get an entire portfolio allocated at those interest rates.

This also all assumes a relatively low default rate which may not be true for people trading crypto currency on margin in the long term (only have a few months of real data to work from). It maybe long term profitable as well, but given that that there are no statistics yet on this market, it is hard to make accurate projections. However if using US equity lending as an example, most brokerages seem happy to lend to you at about 6%, so assuming the underwriting model for margin accounts is similar, then this could offer decent long term returns.

This approach is also somewhat similar to peer to peer lending (eg prosper and lendingclub), so could offer similar returns, but is probably a level up on the risk spectrum (above say junk bonds). Bear in mind that any defaults that occur could be long term expensive, because you lose out on the long term price appreciation potential of your currency of choice – it would be disappointing if you lost half your coin stash on lending, only to see your chosen coin price rise into the clouds in the following months.

In summary, it is worth a look as an idea, but there is significant “very bad event” risk for any crypto currency exchange platform that is hard to quantify. It would almost definitely not be prudent lending out your entire monero stash, in case in does not perform as expected. However investing about 5% to 25% of your monero stash in margin lending can give you “pseudo dividend” on an investment which otherwise doesn’t yield anything – but you might wish to spread your lending over multiple exchanges.

Monero XMR – Trading Update – 26-Aug-2016

Monero XMR – Trading Update needs to be given this week, specifically because the market has recently moved massively upwards since the latest trading update in March 2016.

Please note that due to market volatility it is quite hard to capture consistent pricing for screenshots – so any prices given or calculations done using those price are only indicative (but they should still be approximately correct).

Monero XMR – Trading Update – Overview

As of Aug 22nd 2016 there are currently available approximately 12.8 million Monero XMR. With a current Monero XMR price of $4.20 USD, that gives a marketcap of approximately $53.6 million (in USD). This size compares it with a small penny stock, so it still has significantly size to grow if it is even slightly adopted for any mainstream uses. The following screenshot from coinmarketcap.com gives a quick overview:
XMR Aug 2016 Market Capitalisation - 20160826

Since most people probably have not heard of it this is a quick overview – Monero is an alternative currency (sometimes referred to as “coins”) with the most well-known being Bitcoin. In the last 2 years there have been many such coins created for a diversity of purposes. These new “coins” are the brave new world for cryptographic currency (“cryptocurrency”, or even “crypto”), but are still in the early adoption phase. One of the main selling points of Monero is that it can mathematically provable as truly anonymous, unlike Bitcoin with can be traced via the Block Chain. It is one of the foremost alternative crypto currencies that has actually survived long enough to potentially become a replacement for the well known Bitcoin (BTC). For some more background you can review our original investment from last year.

Monero XMR price since inception

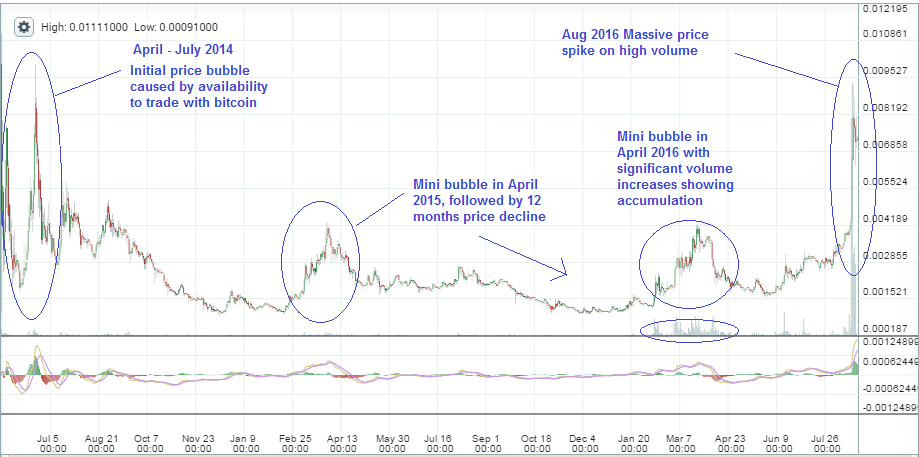
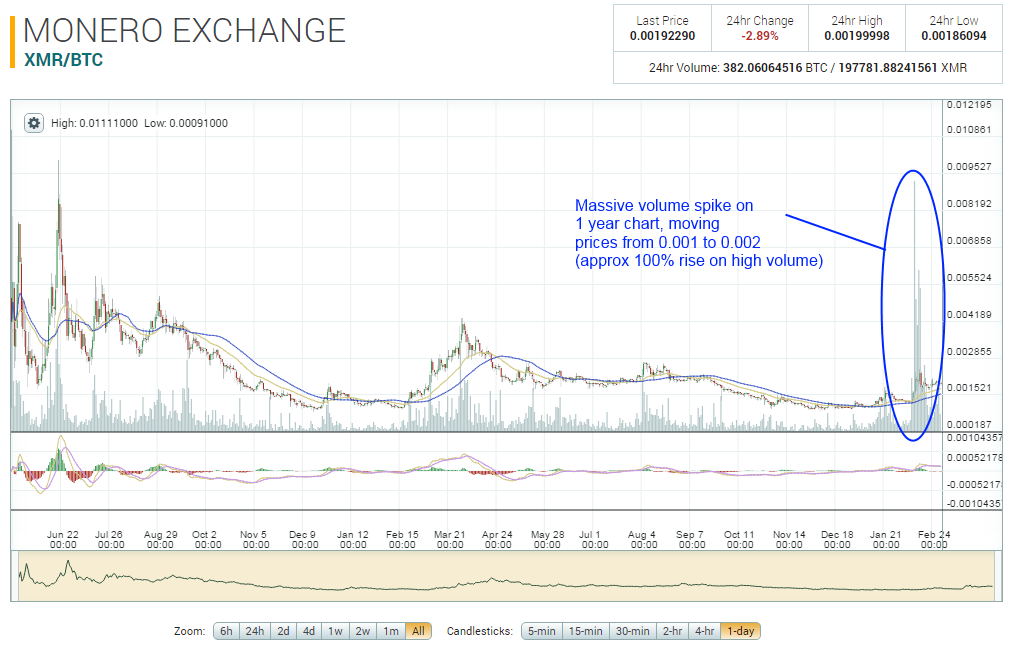
The following chart shows the price swings for Monero since inception, priced in Bitcoin BTC. This highlights the mini price bubbles on inception, in Mar 2015, Mar 2016 and most recently in Aug 2016. You can track the real time Monero XMR to Bitcoin BTC price here.
Monero XMR Trading Update Monero Historical Price Chart Since Inception 20160826

Monero XMR Trading Update – Year to date 2016

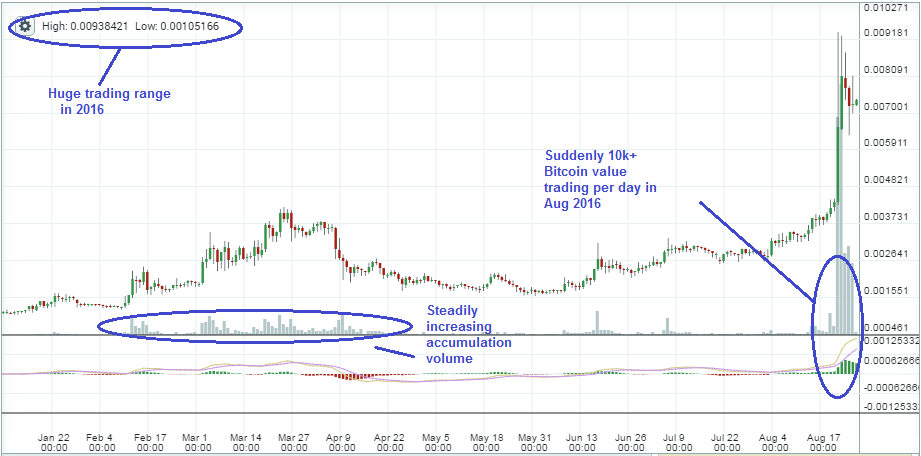
This price move appears to be a significant move on large volume, therefore worthy of a trading update. Monero XMR is going up because of fundamentally wider adaption in other market places, which means that it will get used as currency of choice by more people who want crypto currency. Specifically this move has been driven by news that leading dark net market will start supporting Monero. The assumption is it will win the war to be adopted as the primary crypto currency, potentially ultimately replacing bitcoin (but that is several years out). Don’t know if move is sustainable in short term, but it’s based somewhat on fundamentals, not just a speculative pump (with no reason) which sometimes happens with these coins.

The following chart zooms in to show the significant volume move year to date up to August 2016. From a low of 0.00105 BTC to a high of 0.00938 BTC, with a current trading price of about 0.00735 BTC on 22nd August 2016. In the last week Monero has traded approximately 65,000 BTC on poloniex. Assumming the average Bitcoin price of $576, that is approximately $37.4 million USD.
Monero Historical Price Chart YTD 2016 20160826

Valuing Monero in US dollars

Importantly all the Monero charts shown above are valued in Bitcoin BTC. The Monero Bitcoin XMR BTC exchange rate is more reliant on the value of bitcoin itself. So if you liquidate any Monero using the XMR BTC price you then obviously end up holding Bitcoin, which can obviously have it’s own price volatility (and is a competitor for Monero). For example if positive Bitcoin related news caused the Bitcoin price to rise faster, the XMR BTC will go down even though nothing may have fundamentally changed with Monero.

Therefore looking at the Monero XMR exchange to USD dollar can be a better independent value indicator because it doesn’t depend on value of bitcoin.

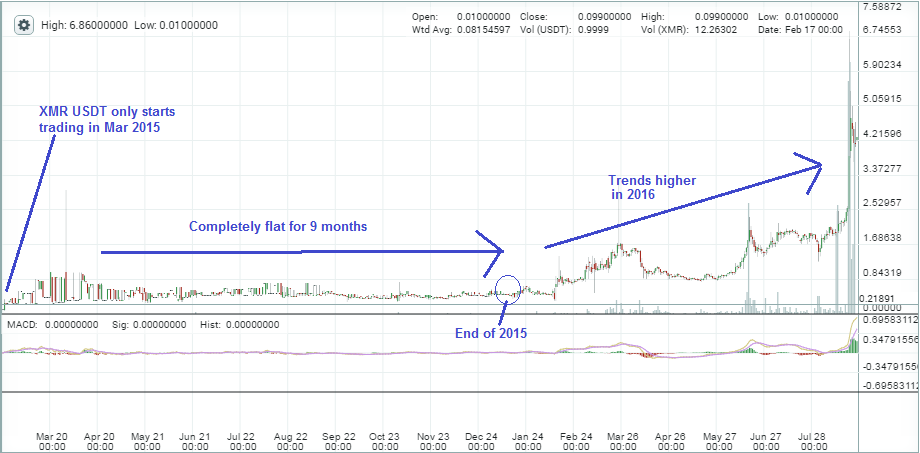
There is a USDT coin that literally stands for “US Dollar Tether” which is a coin representation of USD cash. As the following chart shows Monero XMR to USDT (USD dollar) price is at all time highs in USD, similar to Monero XMR Bitcoin BTC price. However Monero has always mostly trended upwards in USDT (US dollars), without the Bitcoin related swings.

Monero USDT Historical Price Chart YTD 2016 20160826

Liquidating Monero XMR into USDT means you are attempting to replicate “cash”, but importantly without having to convert back to physical US dollars. That is if you hold USDT it attempts to represent the equivalent in USD cash in your local bank account, but actually as a coin so you can trade to buy other coin. This is useful because there are increasing regulations about adding usd to coin related investment, and if you are already in the coin eco system this is a good way to “go to cash” with out actually exiting into real US dollars.

Haven’t done enough research to understand USDT long term stability – and its definitely NOT FDIC insured like a bank account! However presumably it is safe enough for a few weeks while you plot your next investment move (or move it to physical USD). However be careful with USDT liquidity if moving from XMR on poloniex, the order book (scroll down search for “Sell orders” section) may only support a few hundred XMR at a time so don’t try and liquidate a huge position without small test orders first.

eBook including our disclosure

In the spirit of full disclosure, our current position is approximately 0.1% of all outstanding Monero so we are definitely “long”. However that has been held from more than a year. The aim is for a buy and hold investment though and we very rarely trade the core position (for example, have made no sales for more than a year). We could exit or scale back significantly if something materially affected the Monero marketplace, however we are more likely to add on weakness not sell. The cost basis of the investment is relatively low, so we are not actively trading day to day. Typically the price drifts along, but then takes off faster than you can react, as per this recent month’s rally – so our investment option is that the ability to time trades around the position is not as important to actually have a position. We have no plans to sell any Monero yet, but if the price went exponentially higher we would sell to cover our original cost basis. However if you are a true believer in cryptocurrency for a long term medium of exchange you’d never sell any this cheap anyway.

If you are interested in learning more we have written an eBook Better than Bitcoin – A Beginners Guide to investing in Monero.

Monero XMR – Trading Update – 02-Mar-2016

This is a Monero XMR trading update because the market has recently moved significantly in Feb 2016. Since most people probably have not heard of it this is a quick overview – Monero is an alternative currency (sometimes referred to as “coins”) with the most well-known being Bitcoin. In the last 2 years there have been many such coins created for a diversity of purposes. These new “coins” are the brave new world for cryptographic currency (“cryptocurrency”, or even “crypto”), but are still in the early adoption phase. One of the main selling points of Monero is that it can mathematically provable as truly anonymous, unlike Bitcoin with can be traced via the Block Chain. It is one of the foremost alternative crypto currencies that has actually survived long enough to potentially become a replacement for the well known Bitcoin (BTC). For some more background you can review our original investment from last year.

Latest Monero XMR price move in context

The following chart shows the price swings for Monero since inception, highlighting the recent move up in Feb 2016. You can track the real time price here.
Monero XMR Historical Price Chart Since Inception 20160302

Feb 2016 Monero XMR price move

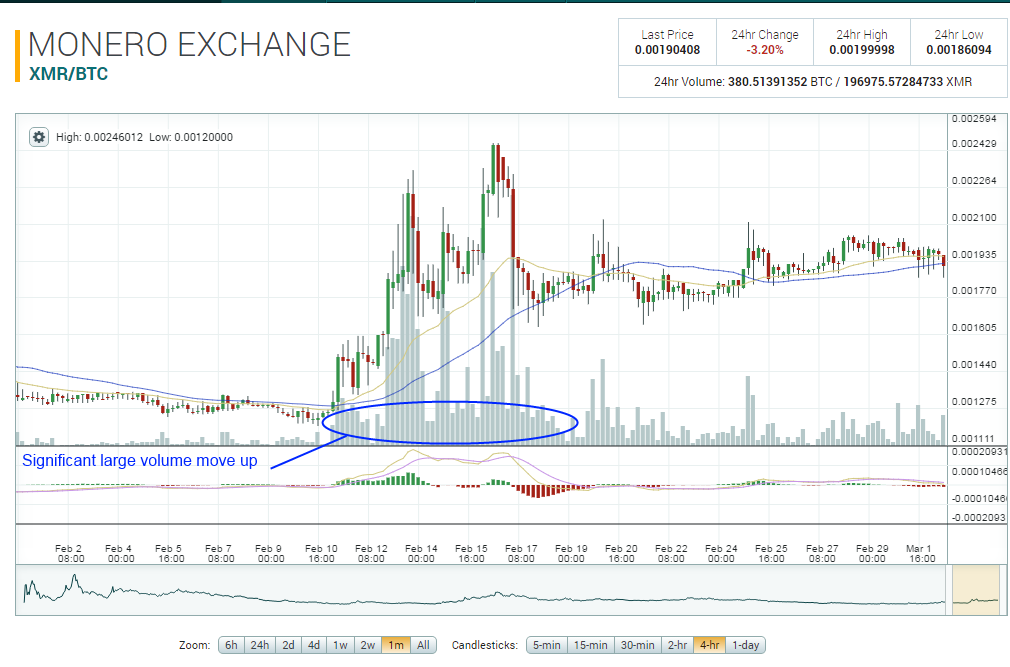
The following chart zooms in to show the significant volume move in Feb 2016 only. From a low of 0.0012 BTC to a high of 0.00246 BTC, with a current trading price of about 0.00194 BTC on 2nd March 2016.
Monero XMR Historical Price Chart Feb 2016 20160302

Please note the Monero XMR market is relatively illiquid and can be easily manipulated by people who already have sigificant XMR stash and wish to “paint the tape” showing large up or down price swings. However this price move appears to be a significant move on large volume, therefore worthy of a trading update.

If you are interested in learning more we have written an eBook Better than Bitcoin – A Beginners Guide to investing in Monero.

Investing in Monero Crypto Currency

Alternative currencies known as “coins” have received a lot of attention in the last few years, with the most well-known being Bitcoin. In the last 2 years there have been many such coins created for a diversity of purposes. Usability as a medium of exchange is one of the distinctive characteristics they have in common. These new coins are the brave new world for cryptographic currency (“cryptocurrency”, or even “crypto”), but are still in the early adoption phase.

Adoption is both a critical measure and a crucial means of success for a medium of exchange. Confidence in the liquidity and fungibility of a currency is a crucial factor enabling adoption. The US dollar, for example, has wide spread adoption. Many worldwide markets transact with it. Consequently, governments and banks around the world keep US dollar reserves. Since World War II it has taken the place of the dominant global reserve currency. The US dollar has popular confidence, because the US government promises never to default on their debts. This promise is respected in part because it is easy to keep, as the US government can always issue more currency to pay those debts, since the dollar has not been backed by gold (a commodity with stable and finite supply) since 1971. The US Dollar is also seen as a store of value, and typically maintains relative price stability compared to other currencies.

The example of the US Dollar illustrates what people what to see in a stable currency. This guide looks into one particular new crypto currency from this list of coins, and gives the investment case for investing in Monero (coin ticker symbol: XMR). We will consider how it may gain adoption, widespread confidence and become a store of value, potentially ultimately overtaking Bitcoin.

Please note the terms “Monero” (the coin name) and “XMR” (the coin ticker) are used interchangeably to refer to the coin.

A Brief History of Monero
Monero is one of the foremost alternative crypto currencies that has actually survived long enough to potentially become a replacement for the well known Bitcoin (BTC). Monero has been in continuous operation since 16 April 2014. Initial miners began to offer it for sale on the bitcointalk.org forum directly thereafter. As many as 10000 XMR traded for 1 BTC in those earliest days. Because of the differences between Bitcoin and Monero protocols and programming interfaces, exchange platforms designed for Bitcoin clones would not work for Monero without extensive modification. When poloniex.com offered a market denominated (as is typical) in Bitcoin, it became easy for Bitcoin holders to buy Monero, and that created an initial price bubble.

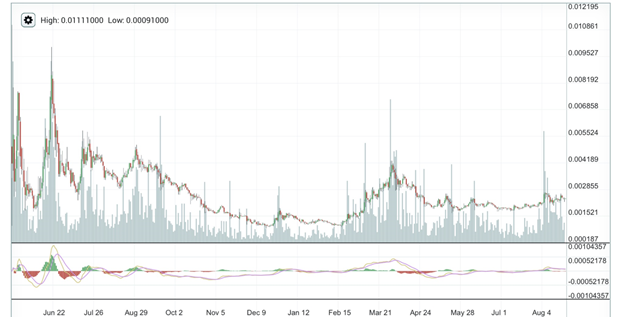
The following chart shows the price swings for Monero in its first 15 months of trading, from a high of approximately 0.011 BTC to a low of approximately 0.0009 BTC, rebounding to the current price in Aug 2015 of approximately 0.0023 BTC:
Monero Historical Price Chart Since Inception 20150810

One of the main selling points of Monero is that it can mathematically provable truly anonymous, unlike Bitcoin with can be traced via the Block Chain.

If you are interested in learning more we have written an Amazon Kindle eBook Better than Bitcoin – A Beginners Guide to investing in Monero.