Category Archives: Trade Exit

Exiting Bitcoin Investment Trust due to Premium

This trade exit on GBTC describes how exiting Bitcoin Investment Trust due to premium was decided. The original GBTC position was purchased in March 2017. To recap the GBTC is an investment trust whose price is tied to bitcoin. The historically high premium to the actual underlying bitcoin price is the main reasoning for selling our GBTC position and replacing it with bitcoin and etheruem products that can replicate similar exposure (without that premium). This trade was IRA eligible so there was no issue of paying extra capital gains by selling after 11 months (instead of waiting for 12 months for long term capital gains to kick in).

Exiting Bitcoin Investment Trust due to Premium

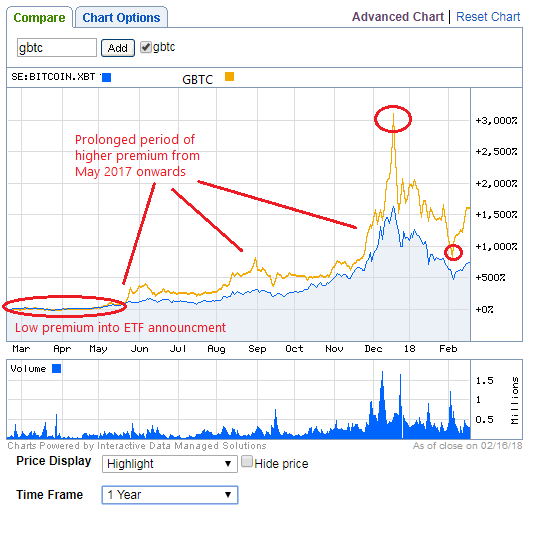
The charts below compares an European based Bitcoin fund SE:BITCOIN.XBT (as a proxy for Bitcoin spot price) with GBTC. This clearly shows that throughout 2017 people have been prepared to pay a huge premium to own bitcoin in their US based brokerage account.

GBTC Feb 2018 1 year trailing premium
Bitcoin Investment Trust GBTC Trade Exit - Feb 2018 1 year trailing premium - 20180215

GBTC Feb 2018 3 month trailing premium
Bitcoin Investment Trust GBTC Trade Exit - Feb 2018 3 month trailing premium - 20180215

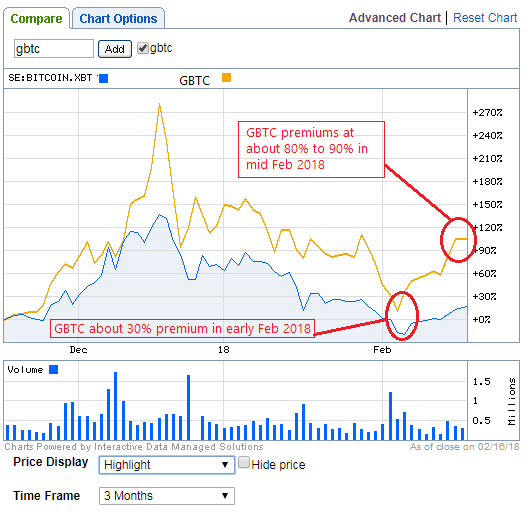
Combined with bullish Bitcoin 2017 price action and inflated premium, the GBTC price has moved up strongly. The above charts and Bloomberg show how the GBTC premium has moved for the last 12 months in a trading range of 50% to 120%. In only the last 3 months the GBTC premium has been as high as 120% in Dec 2017 and low as 30% in early Feb 2018. The premium trades aggressively higher on rallies and lower on sell offs. This behaviour has the effect of amplifying trading extremes, but increasingly makes it a less reliable buy and hold product.

As a recap, when the trade was entered in March 2017 GBTC premium had shrunk down to about 8% because there was the belief that a new Winklevoss Twins bitcoin ETF was about to be allowed by SEC. Once that was announcement was negative, the GBTC premium returned with a vengeance.

According to Bloomberg the average trailing 12 month GBTC premium was 53% (on 16th Feb 2017). By comparison the Bitcoin tracker fund premium was 0.08%. Additionally there is a 2.0% management fee associated with GBTC which is used to help manage the cold storage and security of the underlying bitcoin asset – so any premium paid on the actual GBTC spot price would seem to be excessive. The Bitcoin tracker fund management fee is 2.5% (higher) but since it trades at only 0.08% premium to NAV it is a relative “bargain”.

On 16th Feb 2017 GBTC had a 1 year performance return of 1,574.75% that more than double the Bitcoin tracker fund 1 year return of 774.33%. This is amazing given that the stated aim of the products is identical – the GBTC out performance results are exclusively due to premium.

For reference here are the Bitcoin and Ethereum products available that trade in Europe but can be traded in a US based brokerage account. These products do not have a huge premium to spot bitcoin and are IRA eligible. Bizarrely the swedish Krona product has the higher volume, over the Euro based product. All of these fund products introduce some currency risk exposure, but that is likely less to be way less variable than the GBTC premium risk.

CoinCurrencyInfo
Bitcoin Swedish KronaCOINXBT:SS
Bitcoin EuroCOINXBE:SS
Ethereum Swedish KronaCOINXBE:SS
EthereumEuroCOINETHE:SS

A Good Trade but Poorly Traded

This GBTC trade was ultimately a great investment, but one that was traded frustratingly poorly.

A small tranche was sold in May 2017 to cover the risk on the original position and the rest was left to run as “house money”. Clearly with hindsight that was the “wrong” thing to do, but is it good risk management on a very volatile product – and allows staying in the trade for a much longer amount of time. This risk management part was not poor trading, but the management of the resulting price action in 2017 can be improved – as discussed below.

The final run up into Dec 2017 was not well traded, and therefore missed the significant peak at $39, and survived the drop to $10 in Feb 2017, so decided to exit with some value still intact at $18. This is a very hard trade to take psychologically because of the anchoring to the high point at $39. However the 1300% returns in less than a year is still amazing, yet disappointing from a trading perspective. The split adjusted entry point was $1.44 so clearly this was all “house money” but some exit trading at higher prices should have been achieved into the Dec 2017 peak. This is not purely hindsight – it was clear the short term nature of the blow off top, even during Dec 2017. This does not mean the end of the bitcoin “bubble” – just a medium term trading top that should have been taken advantage of.

Bitcoin Investment Trust premium – Trade Exit

GBTC premium expands on rallies (up to 120% in Dec 2017) and contracts on huge sell offs (down to 30% in early Feb 2017). On trade exit at about $18 that is approximately an average 80% premium, which is somewhere in the middle of the range extremes for the last year. On trade exit with bitcoin at approximately $10k, the book value (or NAV) of GBTC was about $10, therefore there is approximately $8 of premium to nav (or about 80%). Therefore about 1800 shares of GBTC buys approximately one bitcoin, but the book value is about 1000 shares. Clearly there is a convenience premium, but 80% over book value is very high. That does not mean GBTC price cannot rise further, or the premium increase more in 2018. However if the premium ever shrinks to say 30% then it is quite possible to lose money in GBTC even if the bitcoin price goes up. When you buy GBTC at $18 about 45% of your purchase is premium (or “fluff”) over the price of the underlying bitcoin. That is a very hefty premium to spot.

Trade Entry was at GBTC split adjusted $1.44 (actual pre split price at that time was $131) in March 2017 when bitcoin was approximately $1250. Trade exit was $17.96 when bitcoin was about $10025 in Feb 2018.

Trade Replacement

The GBTC investment can be replicated without premium using the Bitcoin tracker funds. Since 1000 shares of GBTC represents approximately 1 Bitcoin, these trading approaches could be taken:

1. Sell 1000 shares of GBTC ($18,000 USD) and purchase $10k Bitcoin tracker fund – this maintains exactly 1 Bitcoin exposure. The remaining $8000 premium can be maintained as cash for future purchases if there is a pull back or for other investments. This maintains bitcoin only exposure.

2. Sell 1000 GBTC then purchase $10k Bitcoin tracker fund and $8k Etheruem tracker fund. This gives exactly 1 Bitcoin exposure but allows using the GBTC premium to buy a new Etheruem position. This has created a slightly more diversified crypto portfolio – but still fully invested in crypto, with no cash on hand.

3. Sell 1000 GBTC then purchase $6k Bitcoin tracker, $6 Etheruem, and keep $6k cash. This gives a less aggressive portfolio because it keeps some cash on hand in case of a pull back.

4. Sell GBTC and maintain cash to wait for a big pullback to invest. If you are a believer in the long term crypto currency bull, this is arguably the biggest opportunity risk – crypto prices are hard to predict and can be notoriously bubbly – so it having exited once at lower prices it is hard to reestablish at significantly higher prices.

These reallocation strategies are all tax optimal in an IRA.

Summary

There is a significant chance that if there is a bullish BTC price march in 2018 towards $20k again then GBTC will do very well. Indeed one day later BTC is already trading 10% higher at $11,000 (so clearly this is proving a badly timed exit). However there need to be discipline to recognize when that the GBTC trade now has premium risk outside of just Bitcoin spot price risk. That risk can be resolved by selling GBTC and buying bitcoin tracker funds.

This is not necessarily a price extreme for bitcoin, but a potentially a premium extreme in GBTC. Still bullish on bitcoin and crypto assets for the next few years, however GBTC may not prove to be a good long term buy and hold product (due to the premium).

In summary this is not purely a bitcoin play, but has become a play on the premium investors are prepared to assign for the convenience of exchange traded bitcoin product. Importantly selling GBTC is a not a bearish call on bitcoin or crypto in general, just trying to avoid being the last one out when playing musical chairs with the premium trade.

Oil Futures – Trade Exit – 29th Aug 2016

We can use Futures Options to enter a bullish oil trade using Crude Oil /CL Bull Call Spread – this gives a slightly bullish bias in oil. The Bull Call Spread is a limited risk reward trade with typically a one to one risk reward. The specific trade was entered on 29th July with $41 / $42 bull call spread when Crude Oil /CL was around $41.5 – essentially attempting to exactly middle the spread around the current price, but still defining the amount of risk to take. The trade cost $5.4, simply $540 per Crude Oil /CL contract. At expiration it could be exited for a max amount of $10 ($460 gain) or expire worthless for $0 ($540 loss). This was slightly worse than our typical 50/50 bet (about a 46/54 bet!) but it was close enough to get the trade executed, without having to wait too long for the market to position itself exactly in between the strikes.

Trade Entry

This shows trade entry prices:
CL Jul 2016 Bull Call Spread trade entry - 20160729

Looking at our portfolio, we also have on a post Brexit short CAD call spread that was acting as a nice counter balance to this trade. The Canadian Dollar /6C and Crude Oil /CL prices are positively correlated, meaning most of the time if oil prices go up, then Canadian Dollar would also rally.

Trade analysis

On 26th August /CL closed at $47.29 which is about $5.29 (12.6%!) over our max profit strike, which is very likely to realise the maximum profit of $460 if held all the way to expiration. The current open unrealised profit is $350. The blue rectangles on the Crude Oil /CL option chain below highlight the $41 and $42 strike options that make up the trade. The red circles highlight the strike and delta for the $42 call. This shows that the $42 call has about a 76 delta which meant that it had about a 76% chance of the spread being in the money by expiration (and making the maximum profit).
CL Jul 2016 Bull Call Spread option chain analysis - 20160826

However the 30 day rule period will be up on Monday 29th August, therefore we set the limit profit order to trigger at $400 profit or $9.5 limit (which is 85% of max profit). We would like $400 out of the trade, so we have to set the limit $0.1 higher to allow for commissions. With no commissions $400 profit would be $9.4, but including commissions it is $9.5. Technically there is $60 extra to make in this trade by holding all the way to expiration, but that would be about $940 risk to make $60 over 20 days into expiration so probably worth just closing it. It could be left to expire for next 20 days, but according to the option market there is a still a 25% chance that oil crashes to our higher $42 strike by expiration – so it is safer to exit on Monday for most of the profit and not have to worry about it.

The following chart shows the full trade life cycle marked up with our comments:
CL Jul 2016 Bull Call Spread chart trade analysis - 20160826

Oil Futures – Trade Exit

In the slight oil rally on 30th Aug the limit order was triggered and trade exited. This shows trade exit prices:
CL Jul 2016 Bull Call Spread trade exit - 20160830

In summary we made almost the full profit available in this trade, and exited as soon as possible after the 30 day rule allowed, but still let the market trigger the limit order for us to get the target $400 – this was a solid 74% profit on capital risked (profit $400 / risk capital $540 = 0.74).

Gold Futures – Trade Exit – 15th Aug 2016

Gold Futures – Trade Exit on 15th Aug 2016. We can use Futures Options to go through Bull Call Spread example. We originally entered a gold Bull Call Spread with a slight bullish bias in Gold, but mostly just to get some trades on. The Bull Call Spread is a limited risk reward trade with typically a one to one risk reward. Typically we would pick the options on futures that expire 45 to 60 days out. This gives plenty of time for the trade to move in the expected direction. This means that you don’t have to monitor the trade too closely throughout its lifetime, with is important with a 30 day rule.

However even if the trade is totally wrong, then can likely salvage a bit of value to either exit, or re-establish in the next monthly cycle. e.g. if the trade was placed for $500, it might only be worth $250. At that point could sell the whole spread, then do the same trade at the same strikes for the following month – this simply allows time in the trade if you still like the trade idea.

Gold Futures – Trade Exit

The specific trade was entered on 14th July with $1325 / $1335 bull call spread when /GC was around $1330 – essentially attempting to exactly middle the spread around the current price, but still defining the amount of risk to take. The trade cost $5, simply $500 per /GC contract. At expiration it could be exited for a max amount of $10 ($500 gain) or expire worthless for $0 ($500 loss).

This shows trade entry and exit prices:
GC Aug 2016 Bull Call Spread trade exit - 20160815

On 15th August /GC was about $1345 which is about $10 (0.75%) over our max profit strike, which is not a lot distance for the several days remaining in the trade. The trade had a profit of about $200 out of a maximum of $500, but clearly was only slightly out of money so that could be erased with a swift down move. However on investigating the delta of $1335 call gave about 63 delta which meant that it had about a 63% chance of making money by expiration. However we also know the probability of a touch at a higher strike is much higher than the probability of finishing at a particular strike at expiration. To define that another way – although this was currently looking like a marginal trade, there was still a high probability of exiting with a 50% of max profit ($250 profit target out of a maximum $500) between now and expiration.
There we set the limit profit order to trigger at $250 profit or $7.6 limit. Technically this would be $7.5 limit, but we set an extra $0.1 on the limit price (or $10 value) higher over our profit target to allow for commissions. The commissions on this trade are 2.31 for each option leg for entry and exit, which is $9.24, which is over time this adds up, so moving the limit by $0.1 covers those commissions nicely.
We then went to sleep, and luckily in the morning the limit had been filled due to a nice rally.

The following chart shows the full trade life cycle marked up with our comments:
GC Aug 2016 Bull Call Spread chart trade analysis - 20160825

In summary there was more profit available in this trade that ultimately we didn’t take, however we did make a solid 50% profit on capital risked. Also the trade reversed recently in the last week, meaning that if we had held on into expiration we would know be looking at -$200 loser (using today’s prices). The difference between taking the $250 or waiting for the -$200 loser is $450, so that is a significant swing for the trade size. Therefore taking the profit on the profit target was the right decision, and consistently taking profits on the winners helps balance out any future losing trades. We are getting better about not being disappointed with not making the “maximum” each time, and now we try simply moving on to the next trade.

Brexit exit iron condor

The pound has been relatively flat for a month after the initial Brexit trauma, so we are considering a “Brexit exit” on our existing iron condor. Currently the iron condor is in the middle of it’s range, as the FXB is at $129 and the mid point of our iron condor is $130. Volatility has contracted from 30% on the brexit announcement to around 15% and trending lower towards the original pre brexit range of 8% to 10% implied volatility.

FXB volatility

Looking at the historical FXB implied volatility chart clearly shows the huge peak for Brexit

Brexit exit FXB Aug 2016 Adjusted Iron Condor Volatility Analysis - 20160801

Given that our continued assumption is bearish on the pound, it makes sense to exit the iron condor before it sells off any further. Also the implied volatility contraction from a peak of 30% down to about 15% makes it more attractive to buy back the short option premium.

From our previous post the original trade was an iron condor at $149/$144/$130/$125 was placed on 16th June (pre brexit). Iron condor was adjusted on 27th June (FXB adjustment is in section “Brexit trading update – Monday”) by adding bull call spread $148/$143 and short call spread $135/$130.

FXB trade exit

The $130/$135 short out spread was slightly ITM giving the trade a slightly bullish deltas, and since our assumption is still bearish we are ok to close out the entire trade for a profit. Given that FXB moved more than 15% after brexit, this is definitely a good result. We could leave on the short call spread $130/$135 to keep short position on the table. However we are trying to more disciplined with our trading approach of “on as a package” and “off as a package” for option strategies. Adjustments to strategies in mid trade are ok, but fundamentally it is cleaner to exit and entry all option legs together. This ATM spread that had been already adjusted on with a short call spread vertical $130/$135, was taken off for a loss of -$73.

Brexit exit FXB Aug 2016 Adjusted Iron Condor ATM trade exit - 20160801

The call spread structure at $140 level is mostly worthless now. The generated a $216 profit and can be easily bought back for $50. It probably would be more logically to let the whole thing expire worthless because it’s way out of the money now, but in the interests of housekeeping we will exit now (on the same day the other side is exited). You could easily back an argument for doing nothing with this side of it, but we don’t have the patience to wait 40 days for it to expire to make only $50. All option legs of the entire OTM spread including the long call spread adjustment at $148/$149 was taken off for a gain of $216.

Brexit exit FXB Aug 2016 Adjusted Iron Condor OTM trade exit - 20160801

Brexit exit trade summary

In summary entire trade was exited for a $144 ($216 – $72) total profit across all options legs, but only with $200 at risk after each trade adjustment was applied (so it was a very safe trade). Without a trade adjustment this would have been a $36 winner, however with the potential max risk of approx $600. So in this case the adjustments ultimately made more money due to selling premium and importantly lower the overall max risk on the trade. This shows how in a volatile trading environment adjusting spread by selling premium, can both reduce risk and manage trade profitability. This was only a small profit, but it does show how to manage an option trade successfully even with a 30 day rule.

Brexit Trade Exit – 18-Apr-2016

Last month Brexit Short Pound Long Euro Trade update we started a medium term trade betting that the pound will trade lower into June Brexit on fear of an exit poll. The trade was to short Great British Pounds (GBP) using 3 E-micro futures /M6B in Jun 2016 (symbol /M6BM6), and long Euro (EUR) using 2 E-micro futures /M6E in Jun 2016 (symbol /M6EM6). Each side had a notional value of approximately $26k USD. The 3:2 ratio is simply chosen so that the notional amounts are identical, because of the different contract size for each currency. Trade entry was 14th March 2016. We originally attempted to hold it as a position trade into the brexit referendum date in June 2016, but if our risk management rules take us out we will exit.

The Great British Pounds (GBP) future was the original short, and we sold Euro (EUR) against it to offset the risk somewhat. Because the Euro moves closely with the Pound over last year, this is a fairly closely correlated pairs trade. Pound is relatively flat for last month, and the euro had rallied a bit.
Recall from last month, we also had also completely hedged with opposite fx positions into the March 17th BOE meeting.

Profit Loss update at end week April 15th

Looking at the overall position on April 15th 2016 approximately 1 month later we have:
$250 profit on short 3 E-micro futures /M6B
$350 profit on long 2 E-micro futures /M6E
-$100 on long pound fx hedge
-$150 on short euro fx hedge

M6B Short April 2016 GBP Brexit Pair 20160415 - trade adjustment

Over this month the Pound has been down about 1% and Euro up about 1.5% (so not a huge amount of movement). However this price movement has given some options to make position adjustments.

M6B Short April 2016 GBP Brexit Pair 20160415 - 1 month correlation

We exited all positions, except the Pound future, for a total profit of $100. Then immediately added a stop to buy back the short pound at 1.4269 (entry was 1.4282). This stop was chosen only to allow for about 0.0013 slippage on the micro future and still guarantee a small profit of about $20 on the short future position. This would give us a total minimum profit of about $120 ($100 + $20) on the entire position, and still gives approximately a 1% wiggle room to the stop. However it is still possible (and potentially likely) to get stopped out, but crucially we can still maintain the short pound position with no risk from the overall trade. If we get stopped out, will likely be able to establish at better levels. If GBPUSD continues to go down, then will have established a decent sized position for no risk – if that happens, then likely would exit before the Brexit decision in next few weeks.

Final (enforced) Exit on Mon Apr 18th

Update: as of Monday, got stopped out this morning at 1.4270 so no longer have any position. Note the 0.0001 slippage from the actual 1.4269 stop. Cannot rely on stops to exit exactly at specified price, so always allow for some slippage between the stop and your required exit price. The slippage is typically dependent on product liquidity and when the stop executes. These FX Micro futures on /M6B are typically liquid with 0.0001 spreads during the day, but appear to move to 0.0002 in overnight US trading. You may get better executions during US hours. For example our execution was with only 0.001 slippage at 10.56am.

Total P&L was $120 – we had locked in a gain originally of $350, but that last adjustment from Friday cost us about $230 in giving back profits. However even though it got stopped out today, we did manage the risk well and ultimately turned the position into a “zero risk” trade.

Trade exit final review on Fri Apr 29th

Reviewing this trade again after the exit 2 weeks ago, shows that the in short term the trade theory was invalidated. The following chart shows how the trade would have moved significantly against it, if we had stayed in it.
M6B Short April 2016 GBP Brexit Pair 20160430 - trade exit review

However we did make a small profit – we might look a retrying this trade soon as these high levels. The importance of our risk management is that we are not emotional scarred from being wrong, so we can evaluate any new trade on its merits, not trying to get back to break even.

AGNC – Bull Put Spread – Trade Exit

Agnc moved down, and relatively quickly from May 2nd $33.10 to May 21st $29.55.

The June strike 30 put option has protected us relatively well. However getting closer into June expiration there is battle between negative time decay in the near term Jun (losing money if agnc doesn’t move down) and the positive downtrend in the agnc stock price (making the overall position money). The position is now slightly short agnc with an approximate delta of -0.10.

If we are to hold this position we need an increasing swift agnc decline into June expiration. We took the position off today on May 21st because we got a nice 1.5% downdraft. We still exited with approximately a $500 loss on all 2 option legs position.

Any bounce up in AGNC of more than $1.5 (to $30) could cause losses over $500, so the risk/reward to holding the short for the 30 days to June expiration is skewed to it moving down increasing quickly. AGNC standing still will lose the position money. Any time you *need* the market to move in a particular direction in a relatively short timeframe or you will lose money every day, it is usually not a good risk/reward trade.

There is also significant event risk for mortgage REITs tomorrow May 22nd with Ben Bernanke’s speech at 10am. This will likely be market moving for AGNC based on the FED’s bond buying program.

Overall the position lost about $100, which was unfortunate. However our original investment thesis was that AGNC would remain stable over the summer was proven incorrect. Agnc declined from trade entry $33.20 on March 16th, to $28.55 on May 21st (-14% decline). By way of a simple comparison, only 100 shares of agnc would have lost -$465 + $125 dividend = -$340 (and we were trading 8 contracts, controlling equivalent of 800 shares).

We can roll the entire structure down to lower agnc strikes and try again to make our $100 back. This wasn’t a positive result, but at least we get to try again without significant losses.

Remember we have to hold each option leg for 30 days, which is why we sometimes adjust (add legs) when selling would be easier.