
We have in the last 4 years been involved in buying Nova Scotia real estate and we’ve had to analyse the market to look for criteria we wanted. However we found the real estate broker websites in the Nova Scotia area generally did not good market overviews like absorption weeks and overall property inventory numbers.Therefore we felt we need to write our own Halifax Houses Market Data tool to quickly visualise and compare market trends.
The previous Real Estate Market Data Visualisation Tool was written about 3 years ago for locating individual properties for potential purchases. Now that we have some properties, the new Halifax Houses Market Data tool was developed in 2019. This new tool is for reviewing general trends and market analysis, so we can monitor the existing property investments.
So how do you use Halifax Houses Market Data tool ?
The tool instructions are relatively straightforward:
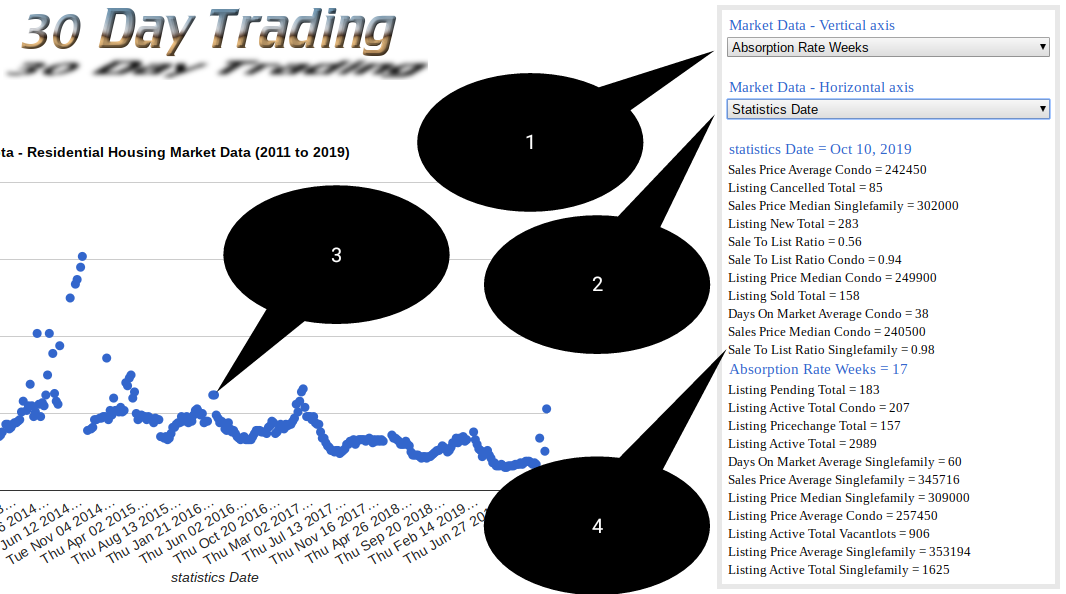
1. Select vertical axis with one of the many market data variables available.
2. Optionally select the horizontal axis with a market data variables, but for most cases it is simply better to maintain “Statistics Date” settings to get a time based chart. If you want to do scatter plot to see data correlations between two variables, then it can be useful to select something other than “Statistics Date” for the horizontal axis. However generally maintaining “Statistics Date” is better to keep a time series.
3. Move mouse over chart data points – left hand side is 2011 and right hand side is now. A tooltip popup will give you the “Statistics Date” for that data point. The vertical axis gives the value ranges for the selected market data variable and the actual value is given below in the market data pane (beneath the select boxes). The chart always plots the selected vertical market data variable against the selected horizontal market data variable.
4. View the market data pane to see all variables for that date. The market data view changes dynamically as mouse moves over different chart data points. Each data point on the chart represent a date has all the market data variables that appear in the market data pane. The two selected axis variables are highlighted on the market data, so it can be easily seen what is selected when moving the mouse over the chart data points.
5. Repeat from point 1 for different market data variables.
The tool can be quickly used to identify long term yearly trends in the market, hopefully to predict best times to buy and estimate future market direction.
Low absorption rate
Absorption rate is the amount of time it would take for all open listings to be purchased (assuming no further listing were added). The absorption rate calculation here is defined as the total number of available homes divided the average number of sales per week. The absorption rate is a number of weeks, specifically the number of weeks it would take for all current housing inventory to be exhausted.
This screenshot shows how the market absorption rate (in weeks) typically moves in a predictable seasonal range with lows in the summer (less houses available) and highs in the winter (more houses available).
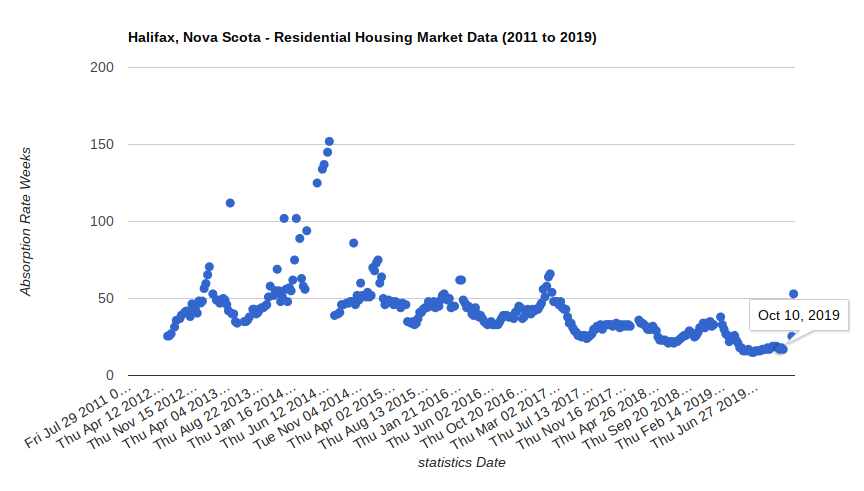
From 2012 to approximately end of 2016 absorption rate went with seasonal moves, from average lows of about 40 weeks, to winter highs of on average about 60 weeks. This pattern repeated each winter from 2012 to 2016, even though there were some 2014 data points with some very significant highs around 100 weeks. Some of the 2014 data points maybe “bad” data points, but the take away is that there was a huge amount of unsold inventory on the market at the time.
However at the end of 2016 absorption rate started a downward trend that is still continuing. The absorption rate has declined with usual seasonal patterns, but importantly seems to be trending lower every year. This would indicate that market conditions are a lot tighter now, with a houses being purchased quicker so that it reduces available market inventory. A faster absorption rate often reduces the amount of quality houses for a buyer, simply because the demand picks off the better priced deals first. From a final high of 65 weeks at the end of 2016 the absorption rate has declined to a low of 17 weeks in Oct 2019. To put this another way – Halifax housing inventory would be exhausted 3 times as quickly in 2019 compared to only 3 years ago. This implies a significant move from a buyers market to a sellers market.
Active Listing for Single Family
Halifax houses market data has been separated into a single family category (removing condos and vacant land) because that is our target property for rentals. This can include multi family up to four units. This deliberately excludes condos, because on average the monthly charges on condos make then inefficient rentals.
The screenshot below shows the number of active listings for single family homes from 2011 to now.
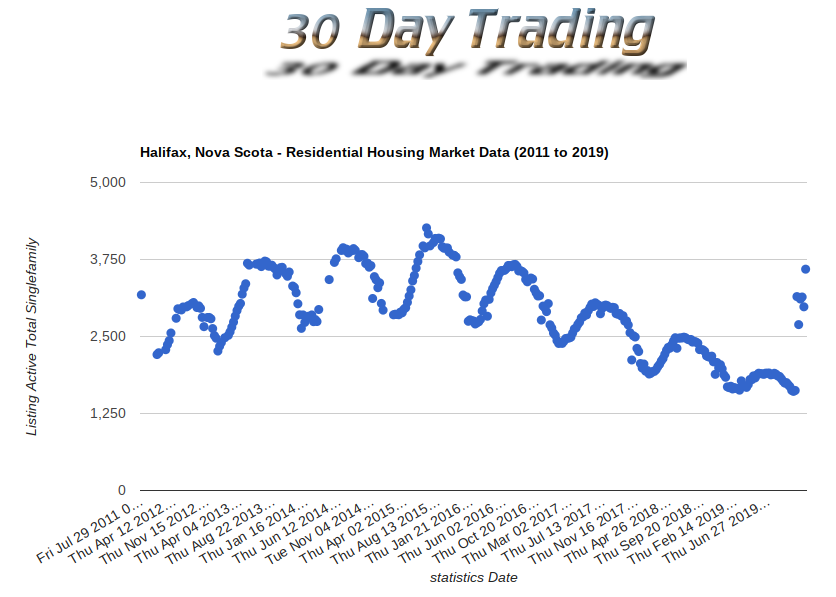
The number of active listing for single family homes has peaked from a high of approx 4,000 in mid 2015 to a low of approx 1,500 in Oct 2019. This would indicate that market conditions are a lot tighter now, with a reduced amount of single family houses to choose from. Similar to absorption rate, this implies a sellers market in Oct 2019.
Data Integrity
Most variables are available from approximately July 2011 to present dates. Some data points for some variables are missing from 2011 to approximately 2013, so there maybe incomplete data points with blank chart data points during those time ranges. Occasionally data points are obvious outliers that can be ignored if they appear way below or above the usual chart curve. The aim of the tool is to look for trends, not get the data absolutely perfect.