Category Archives: Trade Entry

Long Gold calls into 2023

Despite threatening to breakout to new highs in August 2020, the gold price in July 2021 is actually about the same as one year previous in July 2020.

While the Gold price has moved around in a range for the last year, the volatility in the Gold market has been steadily declining this year. This steady decline in volatility is arguably surprising given all the macro economic fallout from the Covid stimulus and other economic measures. However the Gold market appears to be predicting less pronounced moves, at least in the short to medium term.

Since there is low gold volatility we can take more time premium risk than usual and keep the call strike relatively close to the money. Using deep in the money call options is a favorite strategy to get leverage to an underlying without taking the same principal risk as long stock. Buying in the money call options typically means that the majority of the option premium is intrinsic value (“real” value not time value). However the time value of an ITM call option can still be much cheaper when the underlying volatility is low. The spread will also benefit if Gold volatility increases during trade, which is a possibility given volatility tends to be mean reverting.

Gold LEAP diagonal spread

Therefore we can take advantage some of the lowest gold volatility this year, and buy a very long dated LEAP call for Jan 2023 (with a 66 delta). Buying 10 GLD options is approximately the same size as a single call option on a /GC futures contract (obviously assuming similar strikes and expiration dates).

To try and pay for some commissions on the larger trade and get a small amount of income, the shorted dated Sept 2021 $190 call option will be sold (7 delta). This option has a 93% chance of expiring worthless at Sept expiration (100 delta minus 7 delta). But also a 14% chance of being touched between now and expiration (“double the delta”). Using the shorter dated short call does chip away at the cost basis every month. However it does mean that would likely have to roll and re-evaluate position if GLD price shoots up more than 10% in a couple of months – from todays close price $171 to $190 in September.

As of close on July 14th this gives the spread a long delta of approximately 58 delta. The long dollar amount for 10 contracts gives about $99,180 equivalent gold exposure (specifically $171.04 GLD price x 1000 shares x 0.58 spread delta). The long call Jan 2023 call is $19.85 and the short Sept 2021 call was $0.42, giving a maximum risk is $19,430 until Jan 2023 in approximately 18 months time. The maximum risk amount is calculated by (long 10 contracts x 100 x $19.85) + (short -10 contracts x 100 x $0.42) = $19,850 – $420 = $19,430. However there is plenty of time to adjust between now and Jan 2023, so the likelihood of realizing the full loss is low.

Trade Date
Category
Trans Type
Description
Symbol
Quantity
Price
Amount
14-Jul-2021
Portfolio
Sell to Open Short Call
Call GLD 190.00  EXP 17-Sept-2021
GLD210917C190
-10.0
0.42
$420.00
14-Jul-2021
Portfolio
Buy to Open Long Call
Call GLD 160.00  EXP 20-Jan-2023
GLD210120C160
10.0
19.85
-$19,850.00
TOTAL
$ 19,430

Importantly if GLD goes over $180 the Jan 2023 $160 will over its breakeven price, and will begin to trade more like an underlying stock position as the option delta moves towards 100. The call option leverage allows paying less than $20k to control a $100k gold position. The long dated call also reduces the risk in a protracted gold sell off. Giving time to adjust and roll as conditions warrant (e.g. higher volatility) or gold price opinion changes (e.g. gold price declines and would like to exit to maintain some option value for other trades).

In summary this is a leveraged gold long position as a portfolio "hedge" to avoid "missing out" on a run away gold price. It gives plenty of time for the idea to play out. Additionally the capital efficiency of LEAP calls manages the downside risk, but gives a significant upside potential if Gold moves up in next 18 months.
Emerging Markets Iron Condor

This is another bread and butter trade with an emerging markets iron condor, going out a bit further in time to October with 78 days to expiration (DTE). Emerging Markets ETF EEM has sold off rapidly due to market tariff and rate cut talk this week, which has provided inflated volatiliy. This is a limited risk range bound trade for EEM with the expectation that the market maintains its position over the next two months and that volatility contracts.

Trade entry Emerging Markets Iron Condor

Here is the trade entry for EEM iron condor:


Contracts  Expiry Date  Strike   Price   Amount   Trade
-------------------------------------------------------------
+5         Oct 18 2019  45.00  C $0.05   $ 52.69  Buy to Open
-5         Oct 18 2019  42.00  C $0.74  -$372.25  Sell to Open
-5         Oct 18 2019  38.50  P $0.76  -$317.20  Sell to Open
+5         Oct 18 2019  35.50  P $0.35   $122.79  Buy to Open
-------------------------------------------------------------
Total    	                        -$513.97 (credit)

On trade entry on 2nd August there were 78 Days to expiration DTE through to option expiration on 18th Oct. According to the 30 day rule this means that can consider exiting the trade on or after 2nd Sept. On 2nd Sept this would still leave approximately 48 calendar DTE, so there is plenty of time to adjust or exit. The following table sounds the future trade lifecycle dates when trade exit or trade adjustments could be optionally applied:

Trade Lifecycle for EEM Iron Condor

Trade DateTrade Lifecycle (Optional)Days to Expiration
(DTE)
2nd August 2019Trade Entry - enter Iron Condor according to original trade above78
2nd September 2019(Trade Exit) - optional earliest possible date for a full trade exit according to 30 day rule.48 to 1
13th September 2019(Trade Adjustment) - latest possible date to do a trade adjustment using the same Oct options (trade adjustments must be at least 30 DTE)78 to 30
18th October 2019Trade Exit - latest possible date to exit original Iron Condor with any optional trade adjustments that were added.1
Note: Trade Lifecycle actions that are optional are in brackets like this (Trade Adjustment) or (Trade Exit).

The option deltas sold on each side are approximately 35% on the call and 25% on the put, so there is approximately a 70% chance that the call will be touched, and a 50% chance that the put will be touched anytime between now and Oct expiration. Therefore it is likely that the short options at $42 and $38.5 will be tested at some point on this trade, but it can be held due to the limited risk. The breakeven points of $43 and $37.5 are at the high and low ends respectively of the trading range price action for the last year, so we can be reasonably confident that at some point in the next couple of months EEM could return to the the middle of this range – even if there is likely to be some short term volatility, possibly with the short options being touched.

Trade Summary

The aim will be to close the trade for a $100 to $250 profit after 30 calendar days have elapsed, but this could require being patient and waiting for volatility to come in a bit and the trade to move back into the middle of the range around the $40 mark.

Mexican Bearish Put Diagonal Spread

This trade idea shows how to approach trading the Mexican Market ETF (EWW) with a slightly bearish bias. If EWW maintains its position or goes down slightly over the next month, then this position is likely a winner. The strategy will only make a limited amount of money if a large sustained selloff occurs immediately. The only main directional risk to the trade is a large rally higher. This trade was IRA eligible so using multiple option legs does not generate lots of complex tax reporting, and there was no issue of paying extra capital gains if the trade is ultimately successful.

Mexican market and volatility overview

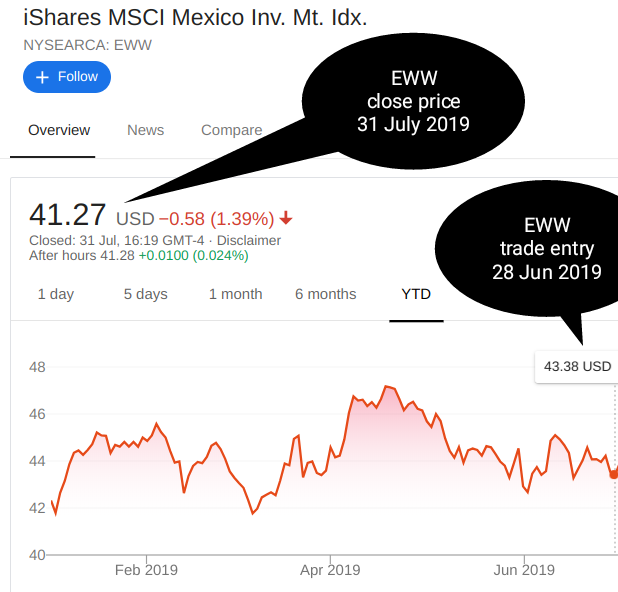
Mexico has been in the news recently due to a lot of tariff talk. This has meant that the Mexican stock market has been trending down since April 2019. EWW has had a high of $47.18 in April 2019 and a low of $41.77 in March 2019. For the majority of 2019 the ETF has been in this trading range between approximately $42 and $47. This relatively confined range and lower volatility makes it a good candidate for a diagonal spread. The trend since April 2019 has been slow ping gradually down so rather than buck the trend we can enter a slightly bearish put calendar spread to take advantage of any ongoing minor sell off.

Mexican Bearish Put Diagonal Spread- Trade Entry Chart - 20190628

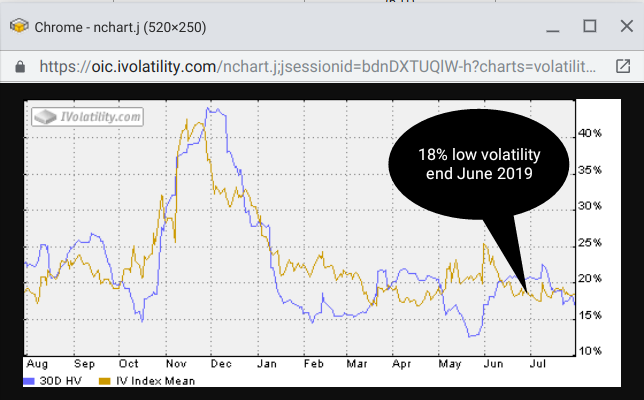
The volatility chart for the last year shows a very wide range of implied volatility there was a huge spike up to approximately 43% in December 2018 when the tarriff talk was at its height. They implied volatility has moved down a lot since then six months later and by the end of June 2019 is approximately 18% which is one of the lowest readings for the year. Therefore it is a good relative volatility level to enter a put diagonal spread that will benefit if volatility increases. We can continue to express a slightly bearish opinion without over paying on trade entry for option premium.

Short EWW Bearish Put Diagonal Calendar Spread - Volatility chart - 20190628

Mexican ETF Trade Entry in June 2019

The trade entry was on 28th of June 2019 as shown in the trade below:

 
Trade Date
Category
Trans Type
Description
Symbol
Quantity
Price
Amount
28-Jun-2019
Income
Buy to Open Long Put
Put EWW 39.00  EXP 20-Sep-2019
EWW190816P42
-6.0
0.72
$434.64

28-Jun-2019
Income
Buy to Open Long Call
Call EWW 43.00  EXP 20-Sep-2019
EWW190920P43
6.0
1.52
-$914.30

TOTAL
$ 479.66

<![if IE]><![endif]>


Summary of Mexican bearish put diagonal spread

This trade was OTM so had approximately a 40% of being ITM at expiration - it was therefore a lower probability trade. Initially selling the shorter dated put help finance the longer dated put, and reduce the overall risk in the position. The Mexican ETF EWW will hopefully drift lower over July without any major move either way.

Brexit trading update – the aftermath

This will be the final general Brexit trading update – after this will resume general separate trade updates, but just wanted to get down all the trading moves made since last Friday and this week.

In summary it is a political mess in UK following Brexit. Prime minister resigned, opposition leader under threat for not campaigning strong enough for stay vote and Scotland threatening to veto the decision. On top of that Europeans telling UK to get on with a timetable for leaving. Not to mention the final hammerblow of England losing to Iceland in Euro 2016 (Brexit likely not as traumatic as the football exit for some people…).

However .. on to the trade update. If your trading account is still alive after the last few days after brexit… Congratulations! We were NOT expecting a leave vote to win, however we have to adjust our positions. Fortunately the implied volatility is still sky high on currencies and equities, so adjusting by selling premium is not that hard.

We are now now bearish USDGBP for the next few months. Not betting on immediate rebound. Any rallies are to be sold. There will probably be huge counter trend rallies based on discussions or actual BOE currency intervention, however those should be taken as a opportunity to short at higher levels. Limited risk reward with all bearish trades (eg call spreads or put / put spreads). Also medium term bearish on UK equities, but fallout from US equities will almost certainly be less for US versus UK. Not convinced that US market will react dramatically to Brexit over next few months (isn’t not likely on it’s own to cause a bear market). Would like to do short premium trades that take advantage of the high implied volatility env. Once again… if your trading account is still alive after the last few days of trading brexit your risk management rules are working.

Our portfolio had a relatively large number of short premium strategies going into the vote. These had to have minor some adjustments after the vote, which we did relatively quickly in most cases. There were also some strategic portfolio hedges to protect existing long positions that were quickly added on the Friday after Brexit (fortunately at pretty decent prices). Here are the trades we actually did …

Brexit trading update – Friday

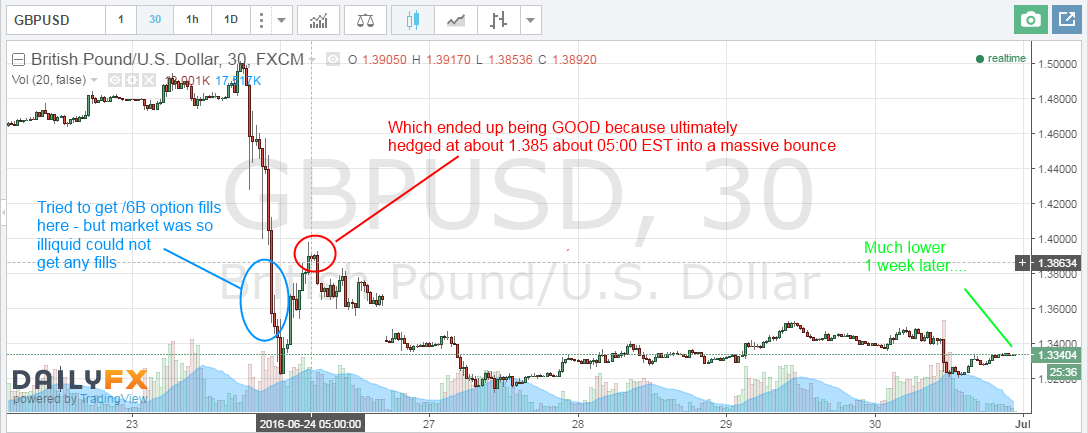
Hedged our entire GBP cash position with a combination futures trade. This was hedged at 1.385 into the bounce on Friday morning at much better prices than overnight.
Brexit trading update - 6B Jun 2016 Bear Call Spread and Put - chart trade entry - 20160624

The combination /6B futures trade was needed to have full downside protection – without over paying TOO much for volatility (although some volatility premium needed to be sacrificed to hedge against total free fall).
Brexit trading update - 6B Jun 2016 Bear Call Spread and Put - trade entry - 20160624

Added these two bearish trades with a SPY put butterfly in the morning and IWM put butterfly near the close. These have no downside risk and were added when vol was high so could get strikes wide apart.

SPY put butterfly
Brexit trading update - SPY Jun 2016 Put Butterfly trade entry - 20160624

IWM put butterfly
Brexit trading update - IWM Jun 2016 Put Butterfly trade entry - 20160624

Hedged our entire Canadian dollar real estate position with a combination futures trade. This might be an over reaction to Brexit because the Canada/USA economic trading relationship is not likely to be directly affected. However if the market goes into “risk on” mode and oil prices decline then the USDCAD rate would suffer.
Brexit trading update - 6C Jun 2016 Bear Call Spread and Put - trade entry - 20160624

Brexit trading update – Monday

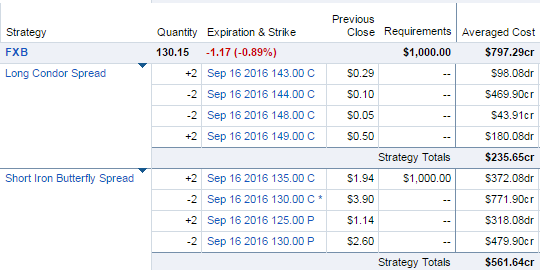
Shorted ATM volatility by adding a short call spread against the tested side of our existing FXB iron condor placed prior to Brexit. Also locked in a guaranteed profit on the short call spread by buying a very cheap call vertical. This is our way of rolling down within the confines of the 30 day rule – without this rule you’d just close out the call spread, and re-sell it at the lower strike. Trade has only $203 risk now:
Brexit trading update - FXB Jun 2016 Iron Condor trade adjustment - 20160627

Sold a QQQ iron condor similar to Tasty Trade’s good trade / bad trade – not our idea, but will take it.
Brexit trading update - QQQ Jun 2016 Iron Condor trade trade entry - 20160627

Short TLT bond call spread – don’t really like this trade from risk/reward (doesnt make much even if right) but just trying to sell bond premium in high vol with limited risk (and start a very small short position at recent all time highs).
Brexit trading update - TLT Jun 2016 Bear Call Spread trade entry - 20160627

Brexit trading update – Tuesday

Didn’t do much because implied volatility had contracted quite a bit, so there wasn’t that much premium to sell. Still not happy with QQQ and TLT positions – slight rise in market or bonds is going to hurt these positions.

Brexit trading update – Wednesday

Didn’t do much, big market rally again. Implied volatility reduced again. Sitting on hands for now. GBP rally somewhat muted given general “risk off” market rally.

Brexit trading update – Thursday

Portfolio is now getting too short for comfort – we have also iron condor established early in June in XME, EWZ that are rallying hard through the short call strike today. Adjusted the QQQ iron condor established on Monday to get some more long deltas in the portfolio.
Brexit trading update - QQQ Jun 2016 Iron Condor trade adjustment - 20160630

Brexit trading update – conclusion

Handled the actual event pretty well, but was caught off guard a bit because do not expect this massive bounce. Lost about 1% of the account in the bounce because pushing too hard on the short side (but that was arguably justifed given the initial market reaction). Ironic though because through out actual brexit in about Monday – the account was flat to slightly up. So navigated it pretty well initially, but frustrated to be losing money in last couple of days when did so relatively well on the initial reaction. Live and learn – and definitely not a write off experience.

Yet another Brexit Trade

Yet another Brexit trade! This is an interesting medium term trade idea – betting that the current hype around June 23rd Brexit poll in the UK is overstated. For the record personally don’t think that United Kingdom (uk) would vote for an eu exit. However there was a poll last Friday that had the leave campaign 10 points ahead.

Therefore due to the perceived risk of an exit the pound and stock markets sold off. Happily for our proposed trading strategy the implied volatility of the options has gone through the roof.

Typically on average implied volatility on options is overstated – and especially for know binary events (like stock earnings or polls). Therefore is makes sense to look at selling options, however with a potential huge move in event of a leave down you would not want to have unlimited risk. The aim is to “safely” sell premium without being on the hook for significant out sized moves of unknown magnitude.

The trade is do a longer term iron condor in FXB options. The only option cycles that are more than 30 days out and available this week are July 2016 (32 days) and Sept 2016 (90 days). Therefore we will pick Sept 2016 (90 days). This is the trade entered on June 15th:

FXB Jun 2016 Iron Condor Brexit trade entry - 20160615

There is still time to do a similar Brexit trade before Jun 23rd this week, as the option will likely remain highly bid up in price into the announcement.

Typically with a 30 day rule would like to give ourselves some wiggle room to exit the trade after the 30 day period has elapsed. This typically means a minimum of a couple of weeks after 30 day period to allow a strategic exit.
Is it possible to do options with only (for example) 32 days to option expiration, but then you have only 2 days at the end for trade exit and you end up very close to option expiration where the gamma risk is very high. We could wait for August 2016 cycle to appear after this June 17th option expiration, but we’d like to get trade on this week as implied volatility looks quite rich.

This Brexit trade is focused on the markets expectation of big move on the announcement itself. The assumption is that result is “stay” (status quo) and that after the announcement the implied volatility of the options reduces and the pound ultimately settles in a range after the announcement. It is important to recognise that the trade could instantly lose money on the announcement but this is capped due to the limited risk nature of an iron condor. There could be a lot of movement in the spread but the bet is that over about 30 days the pins will be in a similar trading range between 1.30 on down side and 1.46 on up side. If there is a sustained violent move in either direction this trade will lose. However according to option pricing on order entry it is has 60% probability of finishing inside the defined range by option expiration, so probability is higher to take a profit at some point during the trade lifecycle. After 30 days and up to 90 days it could move around inside the range if volatility collapses after the announcement as expected it could make money even if it trades outside the range, due to lower option premiums due a volatility crush. There are a lot of variables that make taking a profit on the trade a possibility between now and September.

Brexit Trade – Possible adjustments

Given that this has 90 days to option expiration there are plenty of opportunities to adjust. Typically this would be selling more premium to improve credit received. Even if the trade moved slightly outside the range, sometimes adjustments can be made. This would usually be done by turning the untested side into a butterfly, then selling a vertical close to the money to bring in more option credit. For example if FXB move rapidly upward this what we would do for our trade:
1) purchase a new cheap put vertical otm (to neuralise any downside risk from the existing short put spread).
2) sell a put spread closer to the money to bring in more credit.
This would increase the credit received AND make the trade initially more price direction neutral.

However given that this Brexit trade is limited risk reward it does not HAVE to be adjusted. If goes massively against us initially on the announcement we may have to be content with taking close to max loss. in a very extreme directional move (either way) sometimes there is no good adjustment with an iron condor. Therefore there is some risk that can’t be predicted, however is it limited to the known max loss on trade entry – as long as you are comfortable with the initial risk you shouldn’t have to worry too much about this trade over the actual announcement.

Brexit Trade – Trade Entry – Wednesday June 15th

FXB options are pretty lightly traded and typically have low volume and open interest. Trade entry is always extremely important to the overall iron condor strategy, but very important in more illiquid products. The best strategy is not to rush into getting filled as soon as possible – the trade duration is 90 days so the iron condor pricing will typically not move that significantly in one trading day on options that are that far out in time.
It is very important not to use a market order for this trade because you will get killed on the execution price. A good approach is use a day limit order to enter the iron condor, then cancel and correct if multiple times to get close to best available price. One of the interesting things we have noticed getting filled on illiquid options is that sometimes you can fills above what is considered fair mid price. So it is a good idea to start about 10% over fair value and work down in $0.01 or $0.02 increments. For example of the mid point credit offered is $4.00, start at $4.40 and work down towards $4.00, then keep adjusting down until you get filled. When you get close to mid price and the order hasn’t filled yet, you can leave an order in there for a few minutes to see if it will fill. If it doesn’t fill then just cancel and correct it again for a slightly lower credit. If it doesn’t fill, repeat for a lower credit. Obviously you don’t want to take all day to get the trade done. However in the long run it pays not to be too impatient with this approach, because over multiple trades the savings will add up.

The following is a general trading tip that admittedly only have our own experience to go on, but seems to hold true so far. We have noticed that option spreads in these less liquid currency ETF spreads (like FXB) tend to be a bit wider on the open between 9.30 and 9.45 and the close between 3.45 and 4. The guess is that market makers in these currency ETFs would like to get paid a bit more for hedging the illiquid option risk, especially overnight currency moves are digested. So it is typically easier to get slightly tighter fills on iron condors between 10am and 3pm, and we like to use 11.30 to 1pm (NY lunchtime) because on average the market seems slightly quieter.

Brexit Trade – Profit targets

After 30 days in this Brexit trade is reached we can start looking at profit targets. Typically would look to buy to close the entire iron condor by entered a good til cancelled limit order – that will get triggered at say $2. That would give about $2 profit. Even after 30 days the options will still have about 60 days to option expiration, so this is primarily playing a volatility collapse, not time premium decay. The volatility will likely collapse after the announcement so option premium should decrease significantly.

Brexit Trade update – Monday June 20th

Option volatility reduced on Monday as the market perceives that Brexit is less likely. Risk assets (equities) rallied an fear assets (precious metals) declined assuming that a “Remain” vote was priced in. Additionally the pound rallied 2% against the dollar. The lower option premium makes this trade less interesting now than last week. But interestingly the option volatility adjusted down significantly before the announcement (not on the announcement as we initially anticipated). However volatility could pick again after the announcement, but it is most likely to reduce significantly from current 25% implied volatility towards the last years average of about 10%. If this predicted option implied volatility collapse occurs it will help out our trade (even if the actual price moves against us).

Brexit Trade Entry – 14-Mar-2016

This post describes a medium term trade betting that the pound will trade lower on uncertainty into the June 23rd UK referendum on whether to exit the European Union (EU) – dubbed Brexit by the media.

The trade is to short Great British Pounds (GBP) using 3 Micro GBP /M6B futures in Jun 2016 (symbol /M6BM6), and long Euro (EUR) using 2 Micro EUR /M6E futures in Jun 2016 (symbol /M6EM6).

Each side has a notional value of approximately $26k USD. The 3:2 ratio is simply chosen so that the notional amounts are identical, because of the different contract sizes for each currency. Trade entry was 14th March. This idea was from an FX Crosses trade idea from tastytrade.com, but one that we think we can use within our 30 day Rule restrictions. Typically this would be a scalping trade for few hundred dollars over a day or so, but we will attempt to position trade for a month or more.

For the record personally don’t think that United Kingdom (UK) would vote for an European Union (EU) exit, but with numerous exit polls and political statements along the way there will be a lot of uncertainty into the final results announcement on Jun 2016. However we don’t think we have a crystal ball so our personal opinion is not really relevant, therefore trade will be exited early and not wait for final result. This is trade is focused on the expectation of uncertainty into the result not the final result itself. This is a trade to “buy the Rumour, sell the news” trade or more accurately – because part of trade involves shorting pounds – it should be “sell the Rumour, buy back before the news”.

GBP EUR Correlation

The GBP EUR pair has a very tight correlation of about 0.71 in the last year. So what does that mean for our trade ? To recap correlation values typically vary between -1.0 (negative) and 1.0 (positive). A highly positive correlation means that the two products will typically move in the same direction mostly of the time (S&P 500 ETF (SPY) and Nasdaq (QQQ) would be a good example). A highly negative correlation means that the two products typically move in the opposite direction most of the time (S&P 500 ETF (SPY) and Volatility (VXX) would be a good example. Typically you would be looking for pair trades that were either below -0.5 or above 0.5 – because anything in between that range does not give enough of a correlation pattern (it could just be considered noise).

For the following we are using the relative charts of the ETFs FXB (Pound) & FXE (Euro) to show daily moves over a monthly time frame. For our high level correlation analysis, these E-micro futures move almost identically to these ETFs, so they can be considered equal for this analysis.

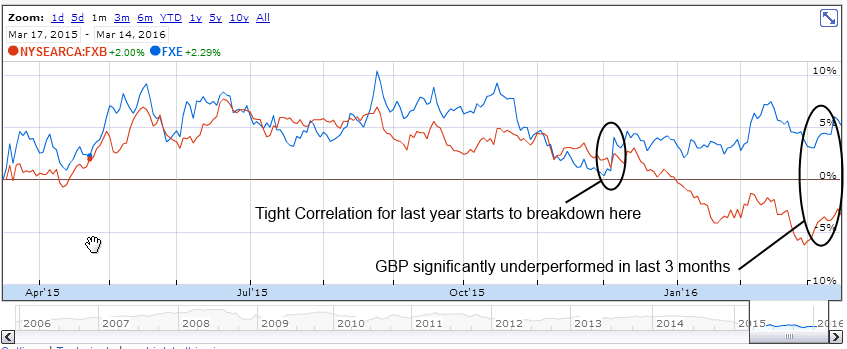
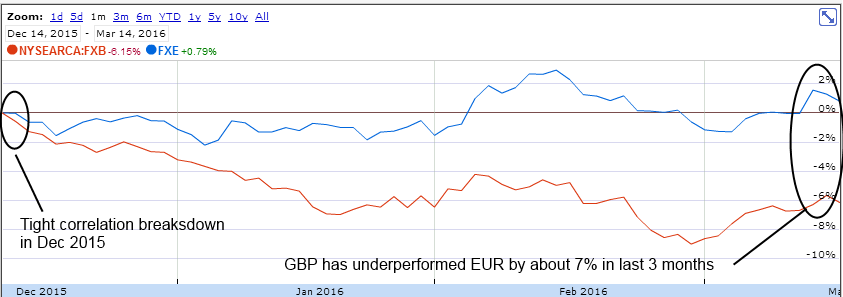
The GBP EUR pair has a very tight correlation for the 9 months of the last year, but there has been a recent 3 month divergence since Dec 2015:
Brexit - 6B Mar 2016 Pound Euro Pair 20160314 - 1 year correlation

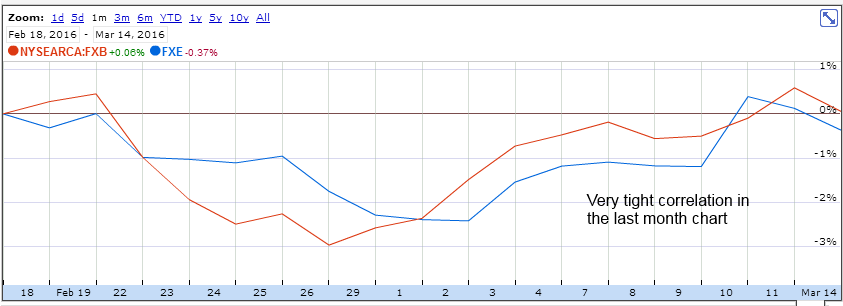
For reference in the last month has extremely tightly correlated:
Brexit - 6B Mar 2016 Pound Euro Pair 20160314 - 1 month correlation

However looking at a zoomed in chart of the last 3 months it is easy to see that GBP has underperformed EUR by about 7%:
Brexit - 6B Mar 2016 Pound Euro Pair 20160314 - 3 month correlation

FED meeting – March 16th

Apart from general market risk, the FX market experiences higher implied volatility and rapid directional moves around central bank announcements. The FED announcement on March 16th and BOE announcement on March 17th will affect this trade.

This trade was not made delta neutral into FED meeting on March 16th. This is because the direction of euro and pound will likely be the same, even if the actual direction is unknown before hand. This trade does not make money guessing direction correctly, it makes money assuming the Pound under performs the Euro in the next month or so. Typically the euro and pound will trade in the same direction, but because we are long/short as a pair in the same amount the direction risk is minimized. It is possible, but not very likely, that the Euro and Pound trade in opposite directions after the FED announcement.

BOE meeting – March 17th

However this trade was made delta neutral before the BOE meeting on March 17th. This was because this is event directly specific to one of the currencies in the trade pair. Remember the aim of the trade is to express the view that the Pound will be weaker than the Euro over the lifetime of the trade into a potential Brexit – however trading central back announcements is just a trade outcome that cant be easily predicted and FX rates react in a very binary way (up or down very quickly). Since this event has the potential to move the GBP side of pair significantly, this introduces unnecessary event risk into our pair, so we will neutralise the trade for the event, and then re-evaluate afterwards.

The trade was totally hedged the night before the event, by purchasing about $26k GBP/USD spot FX and selling about $26k EUR/USD (the exact opposite of our futures position). We cannot exit any trade legs immediately due to the 30 day rule.

At luck would have it, after the BOE meeting at 8am EST on March 17th, GBP moved rapidly higher (i.e. against our original position). By 4pm Thursday compared to 24 hours earlier before the BOE announcement (but after the FED announcement) GBP was 1.53% higher and EUR was 0.76% higher. If we had remained unhedged in the original futures only position into the BOE announcement, this would have lost approximately 0.77% of our trade, or would have lost about $200 of our unrealized $350 profit. However since the trade was now totally delta neutral so our unrealized $350 profit remained, because the spot FX positions exactly offset any movement in the micro futures (as expected).

Brexit Trade Exit – March 17th

Since we have a locked in guaranteed $350 gain, we may just hold the entire structure for a month due 30 day rule then exit with a gain. In future we would also probably just use GBP/USD or EUR/USD spot FX (standard FX trades) versus the Micro GBP /M6B and Micro EUR /M6E futures. Given that the BOE meeting was bullish for GBP we can simply hold this trade with no modifications. However in 30 days time we can reestablish this trade (if we still want to trade the potential Brexit) simply by trading out of the spot FX positions. Alternatively we can just exit all the legs simultaneously and take the profit.

VLCCF – Trade Entry – 19-Dec-2014

VLCCF has sold off massively into year end, mainly due to oil price. All small cap shipping stocks have been destroyed. Fortunately we sold 200 shares for about $14 earlier this year, so we have about $1000 profit to play with. So in Nov 2014 started selling puts against the position, with a view to getting either extra income or being assigned. Vol was high, so was a good play, however was still “early”. Sold $7.5 Dec 2014, when VLCCF was approx $8 in mid Nov, but got totally caned in Dec (but still better than buying stock outright). Put will be assigned (deliberately) today on 19th Dec at expiration on the close today.

Table below summarises our stock position, which has an unrealised loss of approximately ($8.08 average price – stock close price $4.71 x 560 shares = -$1887). However we realised a gain earlier in the year (May 2014) of $1011, selling 200 shares at $14.15. So our total loss on the stock is about  -$876. However we have dividend reinvested, so that is lowering the average price as well (hence the 60 or so extra shares, over the original 500 share position). Original cost basis was 500 shares at $9.79 = $4895. So loss is -17%, however given that stock price is down -%52 since purchase, that could be claimed as a small victory.

Our aim is to try and get out of this position, with a patient long term approach coupled with option trades and tactical stock sales to reduce overall cost basis.

Stock PositionSharesCost Basis /
Average Price
Cost Basis Principal
Existing VLCCF position3608.873193.2
Dec 2014 $7.5 put assignment (deliberately assigned on 19th Dec 2014)200$6.51300
TOTAL560$8.024493.2

The implied vol is 140% (very high) in Dec 2014, so are looking at volatility strategies, namely selling options. The stock is cheap enough (under $5) to consider very conservative put selling strategies, which when coupled with high IV makes it a good candidate for the philstockworld.com style trade (or longer term premium selling). We havent done this trade before, so will be conservative on the first one.

Look at the option chains for June 2015 shows the $7.5 and $2.5 puts. This trade was executed by selling puts and selling calls (premium on both sides).

VLCCF150619C7.5CALL (VLCCF) KNIGHTSBRIDGE JUN 19 15 $7.5 (100 SHS) -5 $221.07 $0.44/Share
VLCCF150619P2.5PUT (VLCCF) KNIGHTSBRIDGE JUN 19 15 $2.5 (100 SHS) -5 $313.12 $0.63/Share

This makes $221.07 (call premium) and $313.12 (put premium) for a total of $552 if VLCCF finishes in between $2.5 and $7.5 in 6 months time. What are the possible scenarios in Jun 2015:

Closes Below $2.5: This is effectively committing to buy 500 shares at about $2.5 – total option premium of $1.07 (or about $1.43 per share). This would be a bad outcome, and would have average price of about $4.75 on 1000 shares. Assuming stock would not go bankrupt (!) would have to look at option premium trades again (to further lower cost basis), or just buy and hold and wait it out. This would not be good, but would be way better than buy and hold from $9.79 to $1 to $2 range.

Closes Between $2.5 and $7.5: since the IV is VERY high there is a higher likelihood that vol reduces over the lifetime of the trade, so that will also give a way to profit even if stock doesn’t move anywhere over the next 6 months. This is like a “psuedo” dividend assuming the stock stays in a ride range – the options market currently prices this at about at 50% chance of happening, but if the IV comes down the percentage chance of it happening will be reduced as well. The “normal” IV for this stock is about 40% and that would price it at about a 75% of chance of happening (much better odds). The P&L here would be the stock P&L, plus about 5 contracts x $1.07 option premium or about $535 (the “pseudo” dividend). If stock price is over $7 by Jun 2015 expiration then this is breakeven on the currently unreleased open positions, however if you add the $1011 profit from earlier in the year, then the breakeven since position inception is approximately $5 (which looks achievable, and is not a bad outcome given that the position was started at $9.79).

Closes above $7.5 : If the stock is above the $7.5 strike in 6 months, then the entire position will be assigned for a profit:   –  $8.08 average cost basis + $7.5 strike assignment + $1.07 option premium = about $0.49 profit on 500 shares. That would make a small gain on $250, which added to $1011 from earlier this year, would give about a 25% profit on original position (and would have exited with VLCCF position with a decent gain, not having given up on it when it was a loser as it is today).

Note: There are an extra 60 shares that have been acquired due to reinvested dividends, but that would just be bonus profit (e.g. if closed at $10, then would get $2.5 * 60 shares = $150 of extra profit). But that was not included above to keep calculations simpler.


SPY Short Put Butterfly – May 2013

We have been running long SPY butterflies for the last 6 months, and on average have lost a small amount of money so far. Mostly because of a continuously rising market for the last 5 months with little downside volatility. THe advantage of a long butterfly placed for a small debit is that typically only that small debit is lost if we are “wrong” on direction.

This month we figured if you can’t beat em join em., and will try some short put butterfly to bring in some premium. Trade Entry right at the close on Fri May 3rd:


    Sale PUT SPY 160 Jun 2013 SPY1322R160 contracts -10 2.42   2,405.50	  - short "head"
Purchase PUT SPY 157 Jun 2013 SPY1322R157 contracts  10 1.54  (1,554.45)  - long "wings"	
Purchase PUT SPY 157 Jun 2013 SPY1322R157 contracts  10	1.54  (1,554.45)  - long "wings"	
    Sale PUT SPY 153 Jun 2013 SPY1322R153 contracts -10	0.85     835.53	  - short "tail"

Total credit : + 0.19 (or $190)

This is a much safer way to sell premium than a traditional put credit spread. The options tend to move all together in the first few days of the trade, showing little p&l for the overall position. However after about 10 to 30 days in a butterfly position the “tail” (lowest option leg) of the butterfly should start to decay faster than the “head” and the “wings” together (the top three option legs). The “head” and “wings” option legs typically follow each other relatively closely until about 10 days out from expiration. With about 10 days to go to expiration, the direction of the underlying starts to make a much bigger difference to the overall position p&l.

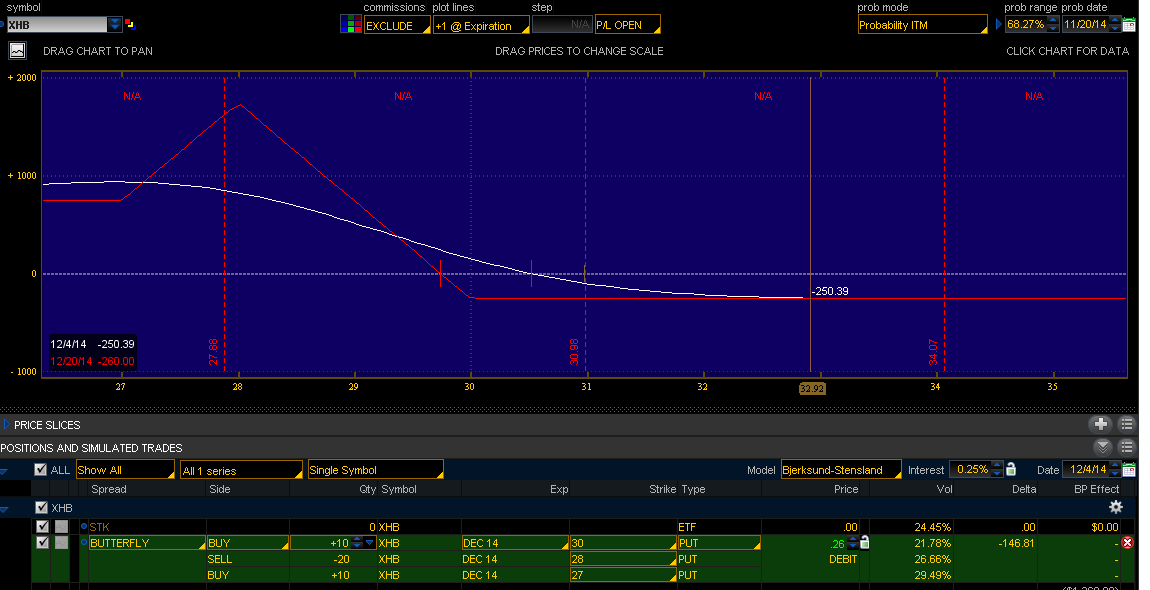
Note: if the market crashes more than about 10% this position will still actually make a small profit. So want the position to go up or remain flat, or crash very hard and very quickly. A slow drift downwards would likely be bad for position over next 45 days to expiration.

This short put butterfly is also a long volatility position – that should make money if volatility picks up, so it is good for this very low volatility environment. Long butterflies (the opposite trade to this one) are great trades when volatility is higher, but they don’t always make sense when vol is this low (unless you are using them to hedge a stock position).

SLV Long Butterfly – April 2013

With silver (SLV) massive selloff the volatility is sky high, which gives us the opportunity to do long butterfly for May 2013 expiration.

Trade Entry on April 15th:


Purchase PUT SLV 22 May 2013 SLV1318Q22.5 contracts 6   1.27  (773.45) - long "head"
    Sale PUT SLV 21 May 2013 SLV1318Q21   contracts -6  0.71  414.54   - short "wings"
    Sale PUT SLV 21 May 2013 SLV1318Q21   contracts -6  0.71  414.54   - short "wings"	
Purchase PUT SLV 19 May 2013 SLV1318Q19   contracts 6   0.33  (209.45) - long "tail"	

Total debit : - 0.18 (or cost -$108)

Investment thesis is that it sells off about 5% from here or stabilizes, while the volatility collapses. We would only lose a small amount in either direction (up or down) if we are wrong, and have the opportunity to make money if SLV stays in the range of 23 to 20.5 near to May expiration. The advantage of a long butterfly placed for a small debit is that typically only that small debit is lost if we are “wrong” on direction.