Category Archives: Bull Put Vertical

Bull Put Verticals are typically short OTM near month put at a higher strike, and long OTM near month put at a lower strike. This is a bullish to neutral trade, typically done when implied volatility is high. Usually done with the same number of contracts on both legs.

Run your own fixed income annuity

Fixed Income Annuity - 19th Century Book - 20200504

Sometimes you just want to make the guaranteed risk return with the possibility of some upside, but with a guaranteed return of principal. This is typically where fixed annuities come in, however they can be expensive with up front load or annual management fees. Fixed annuities can also be structured in an opaque way where it is not clear exactly what investments the product has bought and how they are managed (e.g. trade turnover etc) – in short they are not very transparent.

Please note: A fixed income annuity is a very complex contract between you and the insurance company. Therefore it is not perfectly compared with the actual investments described in this blog – but this is a starting point to see if the flexibility of doing it yourself might give you some more transparency.

So … is it even possible to run your own fixed income annuity style investment ? Preferably with minimal management, without all the fees and long lock up periods. This blog post is a look back at an annuity style strategy that has been executed for the last few months.

Lets assume we’d like to do this with a lump sum principal of $100,000 USD. It is pretty easy to create medium term US treasury portfolio which is close to the risk free return – lets assume we can construct an equal weighted multi year duration portfolio of treasuries up to 5 years out. Technically there is some duration risk on the longer dated treasuries, but it’s decent proxy for a stable risk free return portfolio. A few months ago in Feb 2019 this had a blended rate of approximately 2.5% – yielding about $2500 a year in interest. See this table for the basic treasury portfolio construction:

Price DateUS Treasury DurationUS Treasury Yield (annualised)Principal AmountYield Amount (annualised)
13th-Feb-20196 months2.51$20,000$502
13th-Feb-20191 year2.55$20,000$510
13th-Feb-20192 years2.53$20,000$506
13th-Feb-20193 years2.52$20,000$504
13th-Feb-20195 years2.53$20,000$506
TOTALS$100,000$2,528
See prices from US Government Treasury website

Managing interest rate risk

However over the next few years, rates might go up or they could be cut. Ideally when each treasury expires we’d like to be able to roll into a new treasury bond with a similar or higher interest rate. However by the time that happens the interest rate market could have moved. So how to manage that interest rate risk without risking any principal?

Since Bond prices will increase when interest rates go down some hedge needs to be provided against falling rates. More simply – something that makes money when rates go down.

In March 2019 we started adding to the above treasury portfolio, by using limited risk bullish short put spread in TLT options. In theory TLT should go up if FED was to cut interest rates and go down if rates rise. TLT contains bonds that have an approximate 17.8 year bond duration, so it is not a perfect proxy for own mini fixed income portfolio that has an average duration of about 2.5 years – however it should be correlated at least. Plus TLT does have very liquid options market that is a couple of pennies wide and can often get filled at mid price, so we can be confident of getting liquid fills on the option trades.

This TLT “short interest rates” trade can be done fairly simply using an ATM bullish put spread, with a slight time decay in your favour on trade entry. There appears to nearly always be a small amount of extrinsic value in an ATM put spread appears to be consistently available, because TLT itself has an actual yield – so you would expect to get paid something for holding it for 90 days even if (all other things being equal) the price never moved. For example if the market is $125, you can sell 5 contracts of $126 put and buy 5 contracts $124 put 90 days out for a credit of $1.05. That would give approximately $0.05 of extrinsic value with $1.00 of instrinic value. If TLT rallies over $126 by expiration can make $550 for that quarter, if it closes below $124 lose $450 for that quarter. Obviously if rolling the put options is considered this becomes way more complex, but waiting to close until near expiration is the simplest case.

If you want to replicate a true fixed annuity with no risk to principal, you’d have to be careful size each trade to not risk too much on each TLT put spread. Lets assume we will do one put spread per quarter, and risk $500 per quarter per spread – that would mean in theory we could lose $2000 ($500 x 4 quarters) on the spreads. However since we gain $2500 in treasury interest, so we’d still be $500 ahead for the year. Not great obviously, but that is the theoretical worse case scenario and if we want guarantee to maintain principal then we have to be cautious with the risk. This is an annuity strategy where aim is to take some market risk but only with money gained from interest payments, never from the principal.
If you wanted to take equity risk as well, this could be applied using SPY option spreads, but recognize that is obviously not as tightly correlated to US treasury rates as TLT.
If you did lose money on the TLT spread, that would be an advantage to you when you come to re-invest any expiring fixed income, because the treasury rates would be higher.

To clarify the idea here are a couple of actual trades to show the principal. One is a simple bullish put spread. The second one was a combination of bullish put spread with a bearish short call spread sold against it.

TLT bullish put spread

This trade was entered into in March 2019, then exited closer to May 2019 expiration on 1st May. There was a $369 profit as TLT had traded up slightly. This took approximately 50% of available profit.

 
Trade Date
Category
Trans Type
Description
Symbol
Quantity
Price
Amount
21-March-2019
Hedging
Buy to Open Long Put
Put TLT 121.00  EXP 17-May-2019
TLT190517P121
5.0
0.88
$434.64

21-March-2019
Hedging
Sell to Open Short Put
Put TLT 124.00  EXP 17-May-2019
TLT190517P124
-5.0
2.36
-$1,182.24

TOTAL
-$ 747.60


TLT bullish put spread with bearish call spread

A couple of days later on 3rd May a similar bullish put spread trade was opened June options, but this had an overwrite with a call spread to give the trade some option premium to sell. Normally trades would be rolled the same day, but there was a couple days in between trades because the earlier trade was trigger by a limit order (and didn't notice position was exited).

 
Trade Date
Category
Trans Type
Description
Symbol
Quantity
Price
Amount
01-May-2019
Hedging
Buy to Open Long Put
Put TLT 121 EXP 21-Jun-2019
TLT190621P121
4.0
0.49
$194.24

01-May-2019
Hedging
Sell to Open Short Put
Put TLT 125 EXP 21-Jun-2019
TLT190621P125
-4.0
2.24
-$896.79

01-May-2019
Hedging
Sell to Open Short Call
Call TLT 126 EXP 21-Jun-2019
TLT190621C126
-4.0
0.60
-$241.75

01-May-2019
Hedging
Buy to Open Long Call
Call TLT 127 EXP 21-Jun-2019
TLT190621C127
4.0
0.45
$178.24

TOTAL
-$ 766.06


This trade was entered into on 1st May 2019, then exited closer to June 2019 expiration on 3rd June. This holding period fits with the 30 day rule. Unfortunately selling the call spread did not help the position here as it lost $345.97. If TLT had been flat to slightly down then the call spread would have made money. Fortunately the bullish short put spread made most of the profit ($694.02) because TLT had traded up significantly higher. Exiting the bullish short put spread and bearish short call spread together as a combination though made a total profit of $348 ($694.02 - $345.97).

For reference here is an interactive price chart for TLT that can be used to see the prices from Feb 2019 to June 2019. On chart use minus (-) zoom control to zoom out, then click, hold and move mouse to the right to navigate back to 2019.

Fixed Income Annuity - Summary

This blog post showed how it is possible to take small profits out of TLT to increase yield, but with limited risk if TLT goes down. In this real life example TLT went up, so the May and June spread trades added a few hundred dollars in yield. However if TLT did go down that would be an advantage to the main US treasury principal because new bonds could be bought with higher yield to expiration. This might need some tweaking to make into a better results, but it demonstrates the idea. There is approximately 30mins monthly effort required to analysis, enter, monitor and roll the TLT spreads. Running your own "annuity" product is potentially a lot cheaper than an traditional annuity that charges upfront load fees and annual fees.


Futures Options and Calendars near expiration

Trading futures options vertical spreads and futures calendar spreads can have their own nuances when the trade gets close to expiration. Here we look at some real life examples from our Natural Gas /NG trades in the past few months.

Future Options Vertical spreads

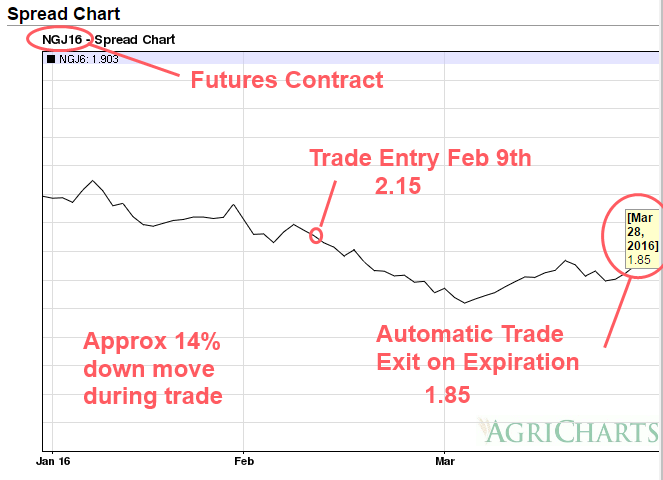
What happens when both legs of a natural gas spread trade expire in the money at expiration ? Unfortunately in our case here this was full loss on a bull put spread, however given that the natural gas /NG price moved about 14% against the position, we are grateful for the protection afforded by the spread to limit the loss.

NG Mar 2016 Bull Put Spread 20160328 Trade Exit Chart

Both legs of the bull put spread got assigned into their respective futures positions at the option strike price, then they immediately get liquidated because they cancel each other out. This is literally buying and selling the same futures contract at the same time at two different prices. This results in an instant profit or loss, depending on what the spread was. The following trades highlighted in red show this exact process. Note that the trade times are all identical, because this was instantly matched by the futures clearing system.

NG Mar 2016 Bull Put Spread 20160328 Trade Exit

Although the future is assigned to the underlying commodity, these are options on futures that settle to the futures. Importantly the options expire a few days before their underlying future does. This gives you a few days so you don’t end up the proud owner of 10,000 million British thermal units (mmBtu) of Natural Gas!

Fear of Futures Settlement

There are several important dates: option expiration date and futures expiration date. On option expiration if your option is in the money, will be assigned into the futures contract.

If you own the underlying future on the future expiration date and it is NOT cash settled, then you could theoretically be made to deliver or receive the contract amount of the underlying commodity. In practice many brokers will monitor their clients positions and start contacting you if you have a commodity futures contract that requires physical settlement expiring in the next week. For example Interactive Brokers will email you 7 days before the futures contract expires to remind you of your responsibility. They additionally point out that they will liquidate the position on the final trading day if it looks like you are in danger of taking physical delivery.

Obviously for something like natural gas that is (probably) not desirable. However it is conceivable that someone might wish to talk delivery of precious metals, but most future brokers won’t let you.

Futures Calendar Spreads

Futures Calendar spread are buying one futures contract in one month at the same underlying, then at the same selling the same underlying futures contract in a different month. Typically “buying” the calendar spread is short near month, long far month. “Selling” the calendar spread is buying the near month and selling the far month. Typically being long the near month implies a bullish position on the underlying price. Being short the near month implies a bearish position in the underlying. With a futures calendar spread you are looking for it to move in a particular direction. The actual credit or debit received isn’t at relevant as the value you can take it off for. You are literally playing the near month contract against the far month contract, as a relative trade. That is of you are bullish you are betting that the near term contract goes up faster than the far month contract. Obviously they will be correlated and almost definitely move in the same direction, but you are playing the rate of change in the spread between the two contracts – basically a very highly correlated pairs trade but that can still move enough to profit.
Traditionally this is seen as a less risky way to express direction on an underlying. For example a natural gas futures contract for the near month could have a range of $5k a month, but the spread would only move up to $1000. This is reflected in the margin for a calendar spread which can be only a few hundred dollars, so the return on capital can be very good, even if the risk is controlled.

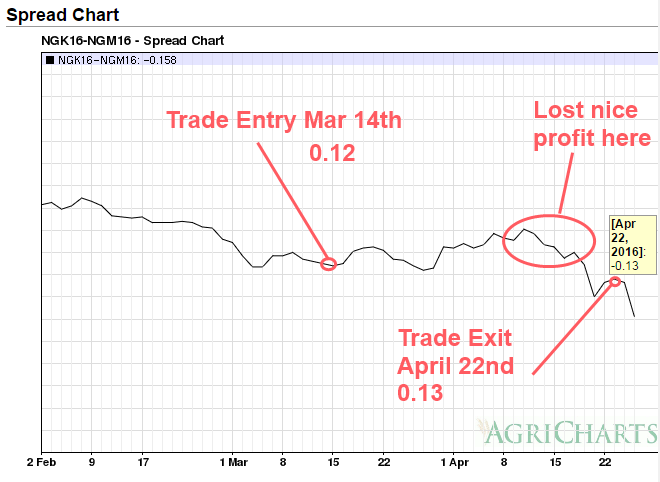
Also calendar spreads seem to see wilder less predictable swings into expiration. These do not always reflect the original trade result, even if the underlying moves as you actually expected. Usually a long near month, short far month futures calendar is typically bullish the underlying. For the example the following chart shows a recent /NG calendar, that was originally trading nicely with our original bullish intent up to about a week before expiration.

NG Mar 2016 Short Futures Calendar NGK6 - NGN6 20160422 Trade Exit

Then the spread suddenly reversed course, even though the underlying near and far month natural gas price went up. The differential between the near and far month changed from as expected in the early part of the month, to significantly inverse in the last few days. This actually ruined a profitable trade very quickly which was unfortunate. Moving from $360 profit to $110 loss (that could have been worse it went as low as $360 loss before we traded out of it). It is important to note again that the underlying price went up, which is what we were hoping for – yet the spread reacted opposite to what we expected. Lesson learned : take a spread profit when it is there, and don’t hang around too long into unpredictable expiration to squeeze out the last little bit of profit.

BTW – This chart was created after our trade has expired using this free historical future calendar online charting tool. This is really useful for checking historical performance quickly, especially to observe historical future calendar spread behaviour into expiration – so you know potentially what to expect in the future.

So what is the conclusion here?

The liquidity for futures contracts typically dries up a lot in the last few trading days of it’s life. This is typically because many traders have rolled their positions to the next futures month.

Combine that with the threat of broker liquidation at unfavorable prices, there is typically not much to recommend trading the final 5 days of a futures option or future contract.

OIH – Trade Entry – 19-Dec-2014

OIH150123P34PUT (OIH) MARKET VECTORS ETF JAN 23 15 $34 (100 SHS) Long 5 contracts $0.62/Share $308.92
OIH150123P35.5PUT (OIH) MARKET VECTORS ETF JAN 23 15 $35.5 (100 SHS) short -5 contracts $0.95/Share $473.11

Total income: $165
Total risk: $575
Risk reward: Approx 3.5 to 1

Trade was a little rushed into due to work commitments and only got it on at the close on Dec 19th.

The right direction, but poor execution in a weekly context (better execution available almost anytime this week). However IV is high enough and it is 40% OTM and direction in Oil should be “up” into the new year. Probably will be ok, but may give some stress next week.