Category Archives: Bull Directional

Strategies that make money when stock or ETF price goes *up*.

Long Energy in 2021

This outlines the investment thesis for starting and maintaining our long energy position in 2021. This is then followed by implementation of the short selling put strategy on XLE energy sector ETF. Selling XLE puts has been an effective strategy in the first half of 2021, however the year started with quite a bit of uncertainty in energy sector. Fortunately the uncertainty provided “fear” in the option premiums, so running a strategy that benefits from high volatility makes sense. Also covered is why some potential XLE trading strategies were rejected due to the higher volatility.

Pricing note: Unless otherwise stated XLE prices are weekly closing prices, not daily close or extreme high/lows intraday.

Investment Thesis

In the previous year 2020 there had already been one huge XLE sell off into the Covid crisis low, which was ultimately hit at $25.86 on 20th March 2020.
Then followed by a 5th June peak around $44.84 within 2.5 months. This was then followed with a steady fall back to $28.72 on 30th Oct 2020.
The year 2020 ended with a very steep 32% rally in the last two months, ultimately ending at $37.90 on 31st Dec 2020. XLE was trending bullish or bearish in either direction for a few months, but then would reverse direction and trend in the opposite way for a few months. This meant that the energy outlook was somewhat uncertain – specifically investors were taken by surprise with Oct 2020 nearly revisiting the March covid low. This 5 year chart shows the context:

On a multi decade chart XLE is also at the bottom of the trading range. The main bearish case for oil producers in the energy sector is that fossil fuels are a dying industry that is destined to be replaced by alternative energy such as wind or solar. This maybe true on a 10 to 20 year time horizon looking towards 2030 and 2040. However energy is cheaper enough on an absolute basis to take a tradable medium term 2 to 5 years position. XLE is trading at the same price as 15 years ago – obviously XLE has paid significant dividends since 2005 so that isn’t a zero percent return – but it is clearly “cheap” based on historical pricing.

Obviously looking at price only does not necessarily make a sector relative good value, so looking at historical price to earnings ratio is another well used metric. One such price to earnings ratio is the Cyclically Adjusted Price-to-Earnings or CAPE for short. CAPE is defined as a valuation measure that uses real earnings per share (EPS) over a 10-year period to smooth out fluctuations in corporate profits that occur over different periods of a business cycle. Looking at the energy sector CAPE shows relatively cheap valuation in 2020 with two annual reading of around 11 (18.42), rebounding to 18.42 as of first half of 2021. This is significantly cheaper than all other S&P sectors in the table below.

Also the percentage of energy sector in the S&P 500 is 2.53% as of July 2020. This will have increased in 2021 due to energy sector rally, but the percentage size compared to other sectors is still historically low. This reflects the energy sector issues, but is small enough allocation that if only some investor capital flows back into energy the sector could grow quickly. This is not an argument for it returning to 20% of the S & P 500 – only that an investor sentiment could see it rally quickly because it’s absolute base is relatively low.

For the full sector chart with all sector percentages – see visual capitalist .

Trading Strategy

All of this historical bearish price action did generate some good option premiums to sell into 2021. Even though XLE has been rallying in 2021, volatility has been high due to the constant threat of a significant sell off.

For other trading positions we’d often use deep in the money LEAP calls and selling shorter term calls to start a new position. That trading strategy often works best on growth stocks or commodities with zero dividends. However XLE isn’t currently a great candidate for that because of the dividend yield, and higher volatility on the long term LEAP calls. Other option trading considerations come into play with higher dividend stocks like XLE – stocks that don’t pay dividends have less chance of having ITM short calls being exercised on you as the contract owner takes the stock to capture dividends. Also overpaying for longer term LEAP calls in high volatility can be a problem if they were purchased with a lot of time value. Generally it is better to start the deep in the money LEAP and overwriting when volatility is lower. XLE isn’t currently a great candidate for that because of the dividend yield, and higher volatility on the long term LEAP calls.

Due the significant sell off XLE had a dividend in 2020 that moved around in the 4% to 5% range depending on price extremes – so buying the stock outright or selling puts to capture the dividend looked like a good approach. Since the energy sector was in play so much, put option premiums generate some significant put premium volatility. Given the combination of high volatility and excellent dividends, selling put options seemed like the best choice. See this historical volatility chart for the trailing 12 months from July 2020 to July 2021, showing the significant volatility spikes in first half of 2021:

It’s hard to time perfectly, but selling puts should generate monthly premium, and worse case secure a stock position in high dividend stock. The risk of selling puts at lower prices (on stock that you want to own long term) is that XLE runs away to the upside too fast, and the opportunity to own stock at a good yield is gone. Ideally would like avoid XLE running away to the upside and having to chase the market to “avoid missing out”. The ideal market for selling puts is one with a bullish or flat bias, with high option premium. Over a number of months, this is a balancing act to sell without the probability of being assigned. Part of the art is to sell options at higher and higher strikes every month, but not so high that when the market reverses at the top all profit is given back on one “bad” put. Selling put with XLE in the range of $40 to $48 out 45 to 60 days to expiration was done in early months of 2021 – but as the market went over $50 the strategy reverted to longer dated 90 day options at strikes in the $45 to $48 range. No put option was ever sold over $48 even though the market went as high as $55.

The red lines on the chart below show where the puts were sold. The start of a line is an opening position (sell to open), the end of a line is a closing position (buy to close) and the price level of the line gives the $ strike. Shorter lines indicate holding periods of 30 to 45 days, and longer lines indicate 60 to 90 days.

Each red line is trade of 10 contracts. Sometimes the risk was tripled up, with a maximum risk of 3 x 10 contracts = 30 contracts. During April 2021 there was theoretically a risk of ($45 x 10 contracts) + ($46 x 10 contracts) ($48 x 10 contracts) of about $139k (minus put premiums sold).However this was only done in rising markets when the older puts were nearly worthless. There was a theoretical risk of 30 contracts, but looking at probabilities the $45 and $46 strikes only had a delta of less than 10 (so had a greater than 90% of expiring out of the money). Also if the market suddenly turned very quickly they could simply be bought back to reduce risk. If there was a flash crash (e.g. a daily move from $50 to $40) then all 30 contracts would have gone in the money – but that volatility was unlikely according to the options pricing. A flash crash “could” have happened but it seemed worth the risk, as it was a very low probability event and the trade was working.

Although at the end of April the final put did get closer to assignment and the market was now trending down. Therefore made the trading decision to go back to 10 contracts only (1 red line) and keep further out of the money. There were still some decent premiums to be had into May because of the increased volatility. As XLE moved higher into May and June moved some of the strikes up because the market was trending upwards, and was ok to double up contract exposure (have 2 red lines or 20 open contracts).

Ended up taking on more risk in a bullish market while the XLE trend was up, but pulling back contract size when XLE was moving down (due to rapid sell off risk). Importantly “risk” here is a relative concept compared to buying XLE outright. Most puts were sold with a 35 delta or lower – which means that on trade entry they have about a 2 in 3 chance (65% or higher) of expiring worthless (making money) at expiration. So they mathematically have an edge of winning each trade, and can typically tolerate at least a $2 to $3 XLE pullback without losing. There is risk here, but XLE has to surprise rapidly on the downside and there are adjustments that could be made should that happen. Worse case end up with a dividend paying stock at a reduce price.

The selling puts trading strategy does have issues if XLE is chased higher and puts are just sold mechanically without regard for price in low volatility. Option volatility tends to decrease in rising markets, so selling near month options at the top of multi month uptrend is not ideal. For example, selling shorter term 45 day to expiration put options at $55 on a market that has just gone from $45 to $55 in a month can be asking for trouble. If that option is sold in lower volatility for $1 but has to be bought back at $4 in the higher volatility of a declining market – then that is $3 of lost premiums. That could be giving back 3 months of premium profits in a few days. It’s not “free” money, it’s money for taking risk and always need to respect the market’s ability to reverse. Market tend to reverse faster than they increase (“stock take the stairs up, but the elevator down”) – which is why the short put premium exists in the first place. Or those who prefer a more dramatic interpretation from the 1800s can always quote “He who sells what isn’t his’n, Must buy it back or go to prison”. Technically short puts are cash secured, but the short selling warning still stands – selling more put contracts than you can cover can be painful.

Margin Requirements

The short put strategy can require keeping the entire cash amount available to cover the short put liability (should the stock be “put” on a price decline). In accounts such as an IRA that require a cash secured put the full amount of cash needs to be available. In a margin account you are still liable to buy the stock back – for example consider 10 short put contracts on XLE at $40 strike that expires in 45 days. If XLE went to $0 (zero) in 45 days you would be required to buy $40k stock. However a broker typically only requires about $8k to $10k margin for a 10 contract short put option in the price ranges of $40 to $50 – even though the theoretical value of the stock position is in the $40k to $50k. The exact margin calculation requirements will move daily with strike price and stock volatility. The return on margin is a fantastic investment return if run successfully each month e.g. For 10 short puts assume $10k margin to sell a $1 option held for 45 days. Assuming $1 option profit every time, and run it about 8 times a year (365 calendar days / 45 calendar day option holding period) and then dividing by the same $10k margin used every time = about 81% annual return on margin. Note that % annual return is theoretical maximum return assuming all puts expired worthless – achieving half of that would be an excellent trading year.

Trading Summary

In summary, selling XLE puts has worked well for last 7 months and using margin can help juice returns. The strategy worked well because XLE went up or sideways and energy markets still had high volatility. However it is important to manage the risk and respect the power of the market by not fighting significant down moves. Recognizing down trends and adjusting position size to reduce risk are important for selling puts. The current plan is to maintain this working trade for the rest of 2021, but could re-evaluate anytime.

Credits: Oilfield Pump (Texas) image used at the top of this page was created by Jcutrer photos. All other credits are referenced inline.

COVID-19 Coronavirus Portfolio

This is a COVID-19 coronavirus portfolio of trading ideas generated in the last two months. The portfolio aim is to identify and invest in new trends in commodities or sector ETFs generated by either government policy monetary policy response or “shelter in place” lockdowns.

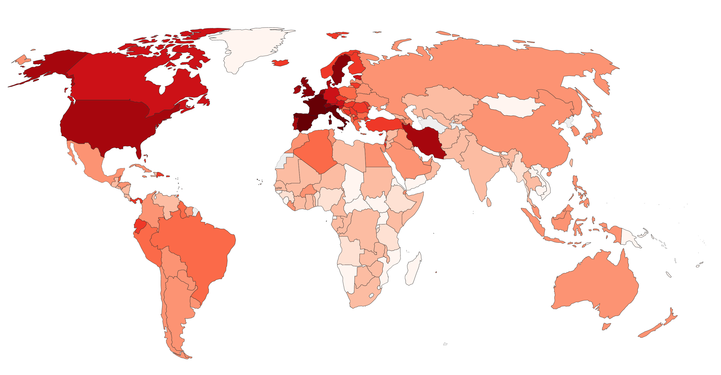
Covid-19 coronavirus portfolio - world map - 20200416

This collection of trading ideas was setup somewhat quickly as a tactical portfolio in response to the COVID-19 Corona Virus situation. The fundamental portfolio theme is that the market has been almost instantly split into winners and losers, Some industries have simply been decimated overnight that they can’t function as viable businesses for the immediate future. For example, even Warren Buffet completely sold all Berkshire Hathaway’s US airlines in April 2020. The aim of this tactical portfolio is to think about trading ideas that can generate winners in the “new normal”.

COVID-19 coronavirus portfolio – Option Volatility

Volatility is very high in most commodities and sectors, so it is critical to use option trading strategies for high volatility environments. Specifically Implied Volatility Rank (IVR) is in the range of 75% to 100% for many ETFs this month. Simple one leg option strategies such as buying out of the money calls in high volatility products will likely not do well. The “go to” trade on ETF options has typically been to buy long dated deep in the calls (LEAPs greater than 9 months out). This means that the majority of premium paid is intrinsic not extrinsic (time) value – the extrinsic value will likely reduce over the course of several months as the current volatility premium likely goes lower. To help with any downside, call spread overwriting and put butterflies on the same ETFs. There was also call spread overwriting in major tech indexes to hedge some downside in tech ETFs that do not have any options. Where no ETF options were available, actual ETF equity positions were taken, but sized appropriately at less than 10% of portfolio size.

COVID-19 coronavirus portfolio – Trade Ideas

The exact thinking behind the ideas need more detailed separate blog posts to fully justify their inclusion. However this tactical portfolio blog post is just to give the trade ideas, their high level implementation and any hedging strategy. This following ideas show the sector, idea rating (buy/hold/sell), the conviction level (low/medium/high) and a high level idea description.

New trades with “Buy” where started in the last 45 days. If a “Hold” is included in this portfolio that means it was already owned, but think performance would improve because of COVID-19 Corona Virus environment. The aim would be to hold most of these for 2020, or until stopped out.

Each paragraph describes a trade idea within a sector (including trade direction), rating (Buy/Hold/Sell) and overall conviction level.

Real Estate and Liquidity

Real Estate (Long). Hold/Buy. Medium. Select international opportunities mostly due to strong USD creating weaker local currencies and lower prices on local real estate. Here “local” means local to a target country in question, specifically Canada and UK whose currencies have been beaten up quite a bit due to flight to safety buying of USD. Keeping liquid in USD to maybe a currency conversion later in 2020 for a property purchase. Not rushing into anything. Actively writing a new Ebook for US investors on future opportunities with international real estate in 2020 and beyond.

Metals

Gold (Long). Buy. High. Gold is one of the best performing assets YTD in USD, and rebounded very quickly with after an initial March 2020 sell offs. The rebound was a direct response to the FED stimulus packages for the general economy. Gold is trading at 7 year highs in USD (near $1700) but importantly gold has made already made new all time highs in just about every other major currency such as Euro, UK Pounds, Canadian Dollars (etc). Select currency and 20 years on this Bullion Vault to chart historical gold price in each currency. Bought deep in the money calls on physical gold ETF (GLD) with an approximately 90 delta for Jan 2022. Aim is maintain a gold position, to ultimately replace with some actual physical gold, when the current spot to physical price premium subside. Aside from just the physical metal, gold miners should benefit from lower oil prices and therefore have reduced input costs, that should increase earnings per share in 2020 and beyond. Gold miners are up about 30% since purchase of Jan 2021 deep in the money calls in both major (GDX) and juniors (GDXJ). These are potentially multi year longs.

Silver (Long). Buy. High. The gold/silver ratio is at about 113 which means that silver is historically very undervalued compared to gold. Interestingly the silver price is approximately tracked the Dow (DIA) year to date, being down about 15% – so it does have more of an industrial market supply and demand component. Gold tends to function as a true safe haven, but silver can influenced by industrial supply and demand from economic conditions. Silver can definitely sell off in a general market downturn, where as gold is holding its value better. However if there is to be a significant gold bull market, silver will tag along for the ride, but may take more time to turn around. Trade was bought physical silver and silver metal (SLV). Bought deep in the money calls with an approximately 85 delta for Jan 2021.

Uranium mining stocks (Long). Potental new uranium bull market for 2020s. Uranium producers and explorer stocks have been one of best performing sector and are up YTD – beating general indexes. Uranium equity could definitely get caught in a wide market downtown, but has tracked higher physical uranium prices that have increased from low $20 to $32 in last month. Ideally this is a very specific sector mining play that should be a play on the physical price of uranium, and should not be correlated to the general market. We play this with a small position in a very small ($4 million market cap!) and brand new ETF of uranium producers URNM. This could be a multi year trade, but the risk reward setup seems good.

Energy

Oil drillers (Long, short vol). Buy. High. Added new full size positions in OIH. Made bullish call last month on OIH was trading at around $4. In OIH sold cash secured $3 puts in July 2020 and Sept 2020, because the implied volatiliy was insane (over 100%), and combined with half a position in long OIH stock. This position bounced nicely, so bought back the short puts for good profit, then hedged the remaining stock with a wide put bufferfly in July 2020. Sold 40% out of the money call in July 2020 to help finance the put butterfly a bit. This is neutral to long ish bias on OIH until July, but it has run up a lot in April so it is sells off in May (seems likely to take a break) then the put buttefly will make some good money, even if the OIH stock loses money. Note that OIH has had a 20:1 reverse split this month, so the $ option strikes mentioned above will need to be multipled by 20 to compare to a current OIH chart.

Oil explorers (Long, short vol). Buy. High. Added new full size position last month on XOP (same timing as OIH trade). Bought a deep in the money for Jan 2021, then overwrite with call spread for May 2020. The call spread recently had both legs in the money and was only 2 weeks to go to expiration. Therefore overwritten call spread was rolled to Jun 2020 for a minor debt. The aim is to maintain the deep in the money Jan 2021 call, and keep overwriting for the rest of the year. If XOP goes up a lot we will capture majority of move. If stays same we can get some income from the high volatility in the call spreads (if they expire worthless). If goes down we will lose, but much less than stock. One advantage is if XOP price goes down fast the implied volality will go up, and so the deep in the money call will stay bid. Note that XOP has had a 4:1 reverse split this month, so the $ option strikes mentioned above will need to be multipled by 4 to compare to a current XOP chart.

Natural Gas (Slightly long, short vol). Hold. Medium. The natural gas etf (UNG) is hard to hold long stock for several months, due to the current contango in natural gas futures. Contango is when near month natural gas futures trade lower than far month future prices. (UNG) maintains its natural gas price exposure by constantly rolling contracts – specifically buying more expensive far month futures contracts, by selling the expiring (and cheaper) near month contract. This enforced rolling built into the product, creates a long term drag on prices while natural gas is in contango (look at any multi year chart of UNG). This is a less extreme version of the same problem with USO contango this week – when the oil price went negative (!). Since owning (UNG) stock is not a good idea, the setup is usually buy a long term calendar call spread, and also selling near dated call spreads on (UNG). This takes advantage of high implied volatility with limited risk, but can still benefit if prices are higher or neutral. This does sacrifice large profits if (UNG) spikes higher quickly and cannot roll fast enough into the price increase.

Natural Gas Producers (Long). Buy. Medium. US natural gas equities have been beaten up in 2020. Clearly there are is a huge over supply of natural gas and a massive worldwide demand shock for energy. (FCG) tracks an equal-weighted index of US companies that derive a substantial portion of their revenue from the exploration & production of natural gas. Approximately 15% of its portfolio is in MLPs and the remaining 85% to equities. Interestingly the (FCG) attempts to recovers some of its 0.6% management fee by securities lending, and it does have a dividend yield but that will likely disappear to much smaller amount in 2020. However to place this in some historical context, many US natural gas equities are trading at the lowest price for 20 years. For example, buying natural gas producers index (FCG) for $5.50, when its all time high is about $155 in July 2008. The US natural gas producers sector at these prices is low enough to be a binary trade. Either the majority of the US energy complex is going bankrupt and this is a slow grind lower for many years (“lose”). Alternatively some energy demand returns, the survivors consolidate and a restructured sector operates at higher price levels at some point in the next few years (“win”).

Equity

Cloud Computing (Long). Buy. Medium. More e-business activity (e.g. Shopify) for starting new businesses and tools for people working for home. This is long equity ETF but focusing on cloud technology (CLOU). Actively trying to ignore struggling parts of economy (e.g. airlines, manufacturing, automative, consumer financing etc). Positions in CLOU and other tech ETFs will be actively hedged with QQQ OTM call spreads.

Mortgage REITs (Long). Buy. Medium. MReits were trading at significant discounts to book value in April 2020 This was definitely a speculative buy with high yields around 11%, especially because dividends could be heavily reduced in next year. However if MReits can simply maintain their value, and allowed to DRIP for a number of years (even at these levels), then they can add some welcome yield and maybe some capital appreciation. MReit ETF (MORT) is a high yield trade great for a portfolio position in an IRA, because it can be allowed to DRIP long term. This is relatively risky play, and only medium conviction. There is no simple way to hedge this using options, so will only take a half position size to manage the risk.

Solar ETF (Neutral). Sold. Medium. Fortunate enough to sell Solar ETF (TAN) around $34 after the bounce back up to $37 in early March 2020 (not the top, but about 20% off the high the way down). This was a risk off trade, which preserved some capital initiate some of the other new ideas in this portfolio.

Emerging Market Equity (Short). Buy. High. Emerging market companies that have debt denominated could have a hard time paying it back, with economic shutdown and currencies depreciating against USD. Emerging market equity like Brazil (EWZ), Mexico (EWW) and India (INDA) have not bounced back as fast as the main US equity markets. For example Brazil has traded in an approximate range of $21 to $26 over last month, down from a Feb 2020 peak of (this is a “L” market chart, not the “V” market chart). Two trades here were 1) out of the money Long Put EWZ butterfly in May 2020, fully financed with short call spread on India market (INDA). This was neutral to bearish. 2) in the money Long Put EWZ butterfly in May 2020 for a debit, and no short call spread. This was more bearish. Brazil equity market has proven to be weaken than India in April 2020 so that seems like a good trade choice approaching May 15th 2020 expiration. INDA trade should expire worthless. Brazil trade already in the money and likely to still be there closer to expiration.

High Yield Corporate Debt (Short). Buy. High, now Medium. Corporate credit quality is being impacted by an unknown amount due to corona virus shutdowns, so that uncertainty would cause high yield corporate bond ETFs to trade significantly lower in the next couple of months. Entered an in the money (ITM) put butterfly as a limited risk reward way to short high yield bond ETF (HYG) on 17th March. HYG was at about $77 then went down 10% in a hurry to around $70. The risk was managed with the limited risk trade structure of an ITM put butterfly, but still got “taken to the cleaners” by the announcement that the FED would be buying junk corporate bonds. This policy announcement caused a huge HYG rally in April from about $70 to $80. Unless there are signs a sharp move down in high yield this week, it will be closed this week approximately 10 days before 15th May expiration – losing about two thirds of original trade capital this week. This is to preserve one third of the remaining principal from a losing trade, as a put butterfly that is now out of the money will decay much faster into expiration. A classic example of a good initially profitable good trade entered for the right reasons, but taken out by unprecedented policy decision. Trade was a loser, but have successfully managed the short risk by not having an unlimited short risk trade on.

Crypto

Cryptocurrency (Long). Hold. High. Bitcoin (BTC) and other alt coins (e.g. XMR). Holding not adding any more.

Liquidity and Hedging

Peer to peer lending – Lending Club (Neutral). Sell/Hold. High. Already dialed back risk here several years ago due to lending club management issues. However this month turned off auto re-investment of cash into new notes. Definitely do not want any more exposure to consumer credit for next year or so. Peer to peer is a small position, but turning off re-investment seems prudent until can figure out what is going with the general consumer lending (does not look good in short or medium term).

Cash (Long). High. Long USD for investment opportunities and saving up to get properties with low LTV. On existing international property businesses we are looking to open small home equity line of credits on properties with low LTVs in local currency (assuming local bank allows it). A small amount of debt exposure in local currency is effectively a long USD position (since we are based in USD). If the local currency for a country where we own property declines significantly we may consider paying down mortgage principal from USD cash.

Hedges (short, combined with underlying positions). Buy. High. Index call spreads overwriting out about 2 months. similar idea to covered covered calls, but with limited risk reward so that if the market does go massively higher are not losing so much (and can probably roll out of it in following months). Selectively combining put butterflies with hedges.

COVID-19 coronavirus portfolio – Summary

This tactical portfolio was created relatively quickly. The main themes were long metals and energy, with some technology and potentially some real estate later in the year. There are also some relatively aggressive hedging and other complimentary short positions. This is a long/short portfolio, that would be much more heavily hedged if world goes “risk off” again. Having good entry points in April 2020 should definitely help holding positions for longer term. The other main theme is keeping very liquid and not over allocating to make sure money is available for opportunities. In summary, only trade if you want to, not because you have to.

Run your own fixed income annuity

Fixed Income Annuity - 19th Century Book - 20200504

Sometimes you just want to make the guaranteed risk return with the possibility of some upside, but with a guaranteed return of principal. This is typically where fixed annuities come in, however they can be expensive with up front load or annual management fees. Fixed annuities can also be structured in an opaque way where it is not clear exactly what investments the product has bought and how they are managed (e.g. trade turnover etc) – in short they are not very transparent.

Please note: A fixed income annuity is a very complex contract between you and the insurance company. Therefore it is not perfectly compared with the actual investments described in this blog – but this is a starting point to see if the flexibility of doing it yourself might give you some more transparency.

So … is it even possible to run your own fixed income annuity style investment ? Preferably with minimal management, without all the fees and long lock up periods. This blog post is a look back at an annuity style strategy that has been executed for the last few months.

Lets assume we’d like to do this with a lump sum principal of $100,000 USD. It is pretty easy to create medium term US treasury portfolio which is close to the risk free return – lets assume we can construct an equal weighted multi year duration portfolio of treasuries up to 5 years out. Technically there is some duration risk on the longer dated treasuries, but it’s decent proxy for a stable risk free return portfolio. A few months ago in Feb 2019 this had a blended rate of approximately 2.5% – yielding about $2500 a year in interest. See this table for the basic treasury portfolio construction:

Price DateUS Treasury DurationUS Treasury Yield (annualised)Principal AmountYield Amount (annualised)
13th-Feb-20196 months2.51$20,000$502
13th-Feb-20191 year2.55$20,000$510
13th-Feb-20192 years2.53$20,000$506
13th-Feb-20193 years2.52$20,000$504
13th-Feb-20195 years2.53$20,000$506
TOTALS$100,000$2,528
See prices from US Government Treasury website

Managing interest rate risk

However over the next few years, rates might go up or they could be cut. Ideally when each treasury expires we’d like to be able to roll into a new treasury bond with a similar or higher interest rate. However by the time that happens the interest rate market could have moved. So how to manage that interest rate risk without risking any principal?

Since Bond prices will increase when interest rates go down some hedge needs to be provided against falling rates. More simply – something that makes money when rates go down.

In March 2019 we started adding to the above treasury portfolio, by using limited risk bullish short put spread in TLT options. In theory TLT should go up if FED was to cut interest rates and go down if rates rise. TLT contains bonds that have an approximate 17.8 year bond duration, so it is not a perfect proxy for own mini fixed income portfolio that has an average duration of about 2.5 years – however it should be correlated at least. Plus TLT does have very liquid options market that is a couple of pennies wide and can often get filled at mid price, so we can be confident of getting liquid fills on the option trades.

This TLT “short interest rates” trade can be done fairly simply using an ATM bullish put spread, with a slight time decay in your favour on trade entry. There appears to nearly always be a small amount of extrinsic value in an ATM put spread appears to be consistently available, because TLT itself has an actual yield – so you would expect to get paid something for holding it for 90 days even if (all other things being equal) the price never moved. For example if the market is $125, you can sell 5 contracts of $126 put and buy 5 contracts $124 put 90 days out for a credit of $1.05. That would give approximately $0.05 of extrinsic value with $1.00 of instrinic value. If TLT rallies over $126 by expiration can make $550 for that quarter, if it closes below $124 lose $450 for that quarter. Obviously if rolling the put options is considered this becomes way more complex, but waiting to close until near expiration is the simplest case.

If you want to replicate a true fixed annuity with no risk to principal, you’d have to be careful size each trade to not risk too much on each TLT put spread. Lets assume we will do one put spread per quarter, and risk $500 per quarter per spread – that would mean in theory we could lose $2000 ($500 x 4 quarters) on the spreads. However since we gain $2500 in treasury interest, so we’d still be $500 ahead for the year. Not great obviously, but that is the theoretical worse case scenario and if we want guarantee to maintain principal then we have to be cautious with the risk. This is an annuity strategy where aim is to take some market risk but only with money gained from interest payments, never from the principal.
If you wanted to take equity risk as well, this could be applied using SPY option spreads, but recognize that is obviously not as tightly correlated to US treasury rates as TLT.
If you did lose money on the TLT spread, that would be an advantage to you when you come to re-invest any expiring fixed income, because the treasury rates would be higher.

To clarify the idea here are a couple of actual trades to show the principal. One is a simple bullish put spread. The second one was a combination of bullish put spread with a bearish short call spread sold against it.

TLT bullish put spread

This trade was entered into in March 2019, then exited closer to May 2019 expiration on 1st May. There was a $369 profit as TLT had traded up slightly. This took approximately 50% of available profit.

 
Trade Date
Category
Trans Type
Description
Symbol
Quantity
Price
Amount
21-March-2019
Hedging
Buy to Open Long Put
Put TLT 121.00  EXP 17-May-2019
TLT190517P121
5.0
0.88
$434.64

21-March-2019
Hedging
Sell to Open Short Put
Put TLT 124.00  EXP 17-May-2019
TLT190517P124
-5.0
2.36
-$1,182.24

TOTAL
-$ 747.60


TLT bullish put spread with bearish call spread

A couple of days later on 3rd May a similar bullish put spread trade was opened June options, but this had an overwrite with a call spread to give the trade some option premium to sell. Normally trades would be rolled the same day, but there was a couple days in between trades because the earlier trade was trigger by a limit order (and didn't notice position was exited).

 
Trade Date
Category
Trans Type
Description
Symbol
Quantity
Price
Amount
01-May-2019
Hedging
Buy to Open Long Put
Put TLT 121 EXP 21-Jun-2019
TLT190621P121
4.0
0.49
$194.24

01-May-2019
Hedging
Sell to Open Short Put
Put TLT 125 EXP 21-Jun-2019
TLT190621P125
-4.0
2.24
-$896.79

01-May-2019
Hedging
Sell to Open Short Call
Call TLT 126 EXP 21-Jun-2019
TLT190621C126
-4.0
0.60
-$241.75

01-May-2019
Hedging
Buy to Open Long Call
Call TLT 127 EXP 21-Jun-2019
TLT190621C127
4.0
0.45
$178.24

TOTAL
-$ 766.06


This trade was entered into on 1st May 2019, then exited closer to June 2019 expiration on 3rd June. This holding period fits with the 30 day rule. Unfortunately selling the call spread did not help the position here as it lost $345.97. If TLT had been flat to slightly down then the call spread would have made money. Fortunately the bullish short put spread made most of the profit ($694.02) because TLT had traded up significantly higher. Exiting the bullish short put spread and bearish short call spread together as a combination though made a total profit of $348 ($694.02 - $345.97).

For reference here is an interactive price chart for TLT that can be used to see the prices from Feb 2019 to June 2019. On chart use minus (-) zoom control to zoom out, then click, hold and move mouse to the right to navigate back to 2019.

Fixed Income Annuity - Summary

This blog post showed how it is possible to take small profits out of TLT to increase yield, but with limited risk if TLT goes down. In this real life example TLT went up, so the May and June spread trades added a few hundred dollars in yield. However if TLT did go down that would be an advantage to the main US treasury principal because new bonds could be bought with higher yield to expiration. This might need some tweaking to make into a better results, but it demonstrates the idea. There is approximately 30mins monthly effort required to analysis, enter, monitor and roll the TLT spreads. Running your own "annuity" product is potentially a lot cheaper than an traditional annuity that charges upfront load fees and annual fees.

Futures Options and Calendars near expiration

Trading futures options vertical spreads and futures calendar spreads can have their own nuances when the trade gets close to expiration. Here we look at some real life examples from our Natural Gas /NG trades in the past few months.

Future Options Vertical spreads

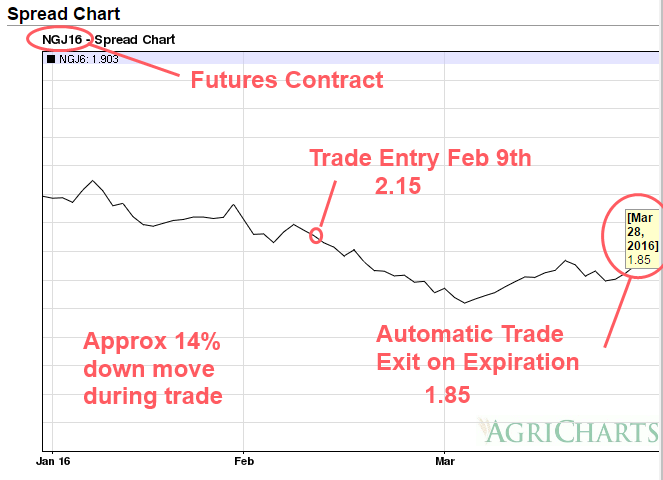
What happens when both legs of a natural gas spread trade expire in the money at expiration ? Unfortunately in our case here this was full loss on a bull put spread, however given that the natural gas /NG price moved about 14% against the position, we are grateful for the protection afforded by the spread to limit the loss.

NG Mar 2016 Bull Put Spread 20160328 Trade Exit Chart

Both legs of the bull put spread got assigned into their respective futures positions at the option strike price, then they immediately get liquidated because they cancel each other out. This is literally buying and selling the same futures contract at the same time at two different prices. This results in an instant profit or loss, depending on what the spread was. The following trades highlighted in red show this exact process. Note that the trade times are all identical, because this was instantly matched by the futures clearing system.

NG Mar 2016 Bull Put Spread 20160328 Trade Exit

Although the future is assigned to the underlying commodity, these are options on futures that settle to the futures. Importantly the options expire a few days before their underlying future does. This gives you a few days so you don’t end up the proud owner of 10,000 million British thermal units (mmBtu) of Natural Gas!

Fear of Futures Settlement

There are several important dates: option expiration date and futures expiration date. On option expiration if your option is in the money, will be assigned into the futures contract.

If you own the underlying future on the future expiration date and it is NOT cash settled, then you could theoretically be made to deliver or receive the contract amount of the underlying commodity. In practice many brokers will monitor their clients positions and start contacting you if you have a commodity futures contract that requires physical settlement expiring in the next week. For example Interactive Brokers will email you 7 days before the futures contract expires to remind you of your responsibility. They additionally point out that they will liquidate the position on the final trading day if it looks like you are in danger of taking physical delivery.

Obviously for something like natural gas that is (probably) not desirable. However it is conceivable that someone might wish to talk delivery of precious metals, but most future brokers won’t let you.

Futures Calendar Spreads

Futures Calendar spread are buying one futures contract in one month at the same underlying, then at the same selling the same underlying futures contract in a different month. Typically “buying” the calendar spread is short near month, long far month. “Selling” the calendar spread is buying the near month and selling the far month. Typically being long the near month implies a bullish position on the underlying price. Being short the near month implies a bearish position in the underlying. With a futures calendar spread you are looking for it to move in a particular direction. The actual credit or debit received isn’t at relevant as the value you can take it off for. You are literally playing the near month contract against the far month contract, as a relative trade. That is of you are bullish you are betting that the near term contract goes up faster than the far month contract. Obviously they will be correlated and almost definitely move in the same direction, but you are playing the rate of change in the spread between the two contracts – basically a very highly correlated pairs trade but that can still move enough to profit.
Traditionally this is seen as a less risky way to express direction on an underlying. For example a natural gas futures contract for the near month could have a range of $5k a month, but the spread would only move up to $1000. This is reflected in the margin for a calendar spread which can be only a few hundred dollars, so the return on capital can be very good, even if the risk is controlled.

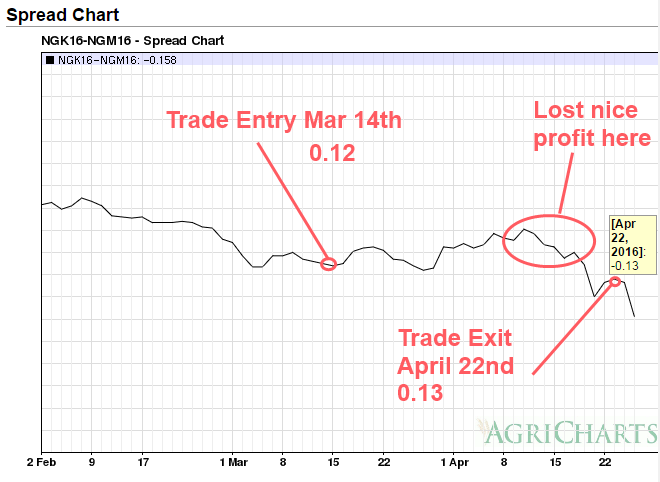
Also calendar spreads seem to see wilder less predictable swings into expiration. These do not always reflect the original trade result, even if the underlying moves as you actually expected. Usually a long near month, short far month futures calendar is typically bullish the underlying. For the example the following chart shows a recent /NG calendar, that was originally trading nicely with our original bullish intent up to about a week before expiration.

NG Mar 2016 Short Futures Calendar NGK6 - NGN6 20160422 Trade Exit

Then the spread suddenly reversed course, even though the underlying near and far month natural gas price went up. The differential between the near and far month changed from as expected in the early part of the month, to significantly inverse in the last few days. This actually ruined a profitable trade very quickly which was unfortunate. Moving from $360 profit to $110 loss (that could have been worse it went as low as $360 loss before we traded out of it). It is important to note again that the underlying price went up, which is what we were hoping for – yet the spread reacted opposite to what we expected. Lesson learned : take a spread profit when it is there, and don’t hang around too long into unpredictable expiration to squeeze out the last little bit of profit.

BTW – This chart was created after our trade has expired using this free historical future calendar online charting tool. This is really useful for checking historical performance quickly, especially to observe historical future calendar spread behaviour into expiration – so you know potentially what to expect in the future.

So what is the conclusion here?

The liquidity for futures contracts typically dries up a lot in the last few trading days of it’s life. This is typically because many traders have rolled their positions to the next futures month.

Combine that with the threat of broker liquidation at unfavorable prices, there is typically not much to recommend trading the final 5 days of a futures option or future contract.

Trading Small with Futures Options

Futures are very large principal products and the underlying value of a single futures contract can be anywhere from $23,000 for natural gas /NG and up to $160,000 for US Treasuries /ZB. This means that for many accounts trading them is prohibitively expensive. However fortunately there are options on these underlying futures, that provide a good amount of leverage. Using futures options it is possible to create trades that only risk a hundred dollars or less to make a few hundred dollars or more. These can have a risk reward of for example 1 to 3 (risk $100 with max profit of $300). This means that you can easily construct trades to work within a portfolio of smaller size for example $50,000. using futures options also allows you to benefit from time decay and also high implied volatility on the underlying (similar to standard equity options). this gives you a lot more flexibility than just trading the futures out right long or short.
Continue reading

OIH – Trade Entry – 19-Dec-2014

OIH150123P34PUT (OIH) MARKET VECTORS ETF JAN 23 15 $34 (100 SHS) Long 5 contracts $0.62/Share $308.92
OIH150123P35.5PUT (OIH) MARKET VECTORS ETF JAN 23 15 $35.5 (100 SHS) short -5 contracts $0.95/Share $473.11

Total income: $165
Total risk: $575
Risk reward: Approx 3.5 to 1

Trade was a little rushed into due to work commitments and only got it on at the close on Dec 19th.

The right direction, but poor execution in a weekly context (better execution available almost anytime this week). However IV is high enough and it is 40% OTM and direction in Oil should be “up” into the new year. Probably will be ok, but may give some stress next week.


VLCCF – Trade Entry – 19-Dec-2014

VLCCF has sold off massively into year end, mainly due to oil price. All small cap shipping stocks have been destroyed. Fortunately we sold 200 shares for about $14 earlier this year, so we have about $1000 profit to play with. So in Nov 2014 started selling puts against the position, with a view to getting either extra income or being assigned. Vol was high, so was a good play, however was still “early”. Sold $7.5 Dec 2014, when VLCCF was approx $8 in mid Nov, but got totally caned in Dec (but still better than buying stock outright). Put will be assigned (deliberately) today on 19th Dec at expiration on the close today.

Table below summarises our stock position, which has an unrealised loss of approximately ($8.08 average price – stock close price $4.71 x 560 shares = -$1887). However we realised a gain earlier in the year (May 2014) of $1011, selling 200 shares at $14.15. So our total loss on the stock is about  -$876. However we have dividend reinvested, so that is lowering the average price as well (hence the 60 or so extra shares, over the original 500 share position). Original cost basis was 500 shares at $9.79 = $4895. So loss is -17%, however given that stock price is down -%52 since purchase, that could be claimed as a small victory.

Our aim is to try and get out of this position, with a patient long term approach coupled with option trades and tactical stock sales to reduce overall cost basis.

Stock PositionSharesCost Basis /
Average Price
Cost Basis Principal
Existing VLCCF position3608.873193.2
Dec 2014 $7.5 put assignment (deliberately assigned on 19th Dec 2014)200$6.51300
TOTAL560$8.024493.2

The implied vol is 140% (very high) in Dec 2014, so are looking at volatility strategies, namely selling options. The stock is cheap enough (under $5) to consider very conservative put selling strategies, which when coupled with high IV makes it a good candidate for the philstockworld.com style trade (or longer term premium selling). We havent done this trade before, so will be conservative on the first one.

Look at the option chains for June 2015 shows the $7.5 and $2.5 puts. This trade was executed by selling puts and selling calls (premium on both sides).

VLCCF150619C7.5CALL (VLCCF) KNIGHTSBRIDGE JUN 19 15 $7.5 (100 SHS) -5 $221.07 $0.44/Share
VLCCF150619P2.5PUT (VLCCF) KNIGHTSBRIDGE JUN 19 15 $2.5 (100 SHS) -5 $313.12 $0.63/Share

This makes $221.07 (call premium) and $313.12 (put premium) for a total of $552 if VLCCF finishes in between $2.5 and $7.5 in 6 months time. What are the possible scenarios in Jun 2015:

Closes Below $2.5: This is effectively committing to buy 500 shares at about $2.5 – total option premium of $1.07 (or about $1.43 per share). This would be a bad outcome, and would have average price of about $4.75 on 1000 shares. Assuming stock would not go bankrupt (!) would have to look at option premium trades again (to further lower cost basis), or just buy and hold and wait it out. This would not be good, but would be way better than buy and hold from $9.79 to $1 to $2 range.

Closes Between $2.5 and $7.5: since the IV is VERY high there is a higher likelihood that vol reduces over the lifetime of the trade, so that will also give a way to profit even if stock doesn’t move anywhere over the next 6 months. This is like a “psuedo” dividend assuming the stock stays in a ride range – the options market currently prices this at about at 50% chance of happening, but if the IV comes down the percentage chance of it happening will be reduced as well. The “normal” IV for this stock is about 40% and that would price it at about a 75% of chance of happening (much better odds). The P&L here would be the stock P&L, plus about 5 contracts x $1.07 option premium or about $535 (the “pseudo” dividend). If stock price is over $7 by Jun 2015 expiration then this is breakeven on the currently unreleased open positions, however if you add the $1011 profit from earlier in the year, then the breakeven since position inception is approximately $5 (which looks achievable, and is not a bad outcome given that the position was started at $9.79).

Closes above $7.5 : If the stock is above the $7.5 strike in 6 months, then the entire position will be assigned for a profit:   –  $8.08 average cost basis + $7.5 strike assignment + $1.07 option premium = about $0.49 profit on 500 shares. That would make a small gain on $250, which added to $1011 from earlier this year, would give about a 25% profit on original position (and would have exited with VLCCF position with a decent gain, not having given up on it when it was a loser as it is today).

Note: There are an extra 60 shares that have been acquired due to reinvested dividends, but that would just be bonus profit (e.g. if closed at $10, then would get $2.5 * 60 shares = $150 of extra profit). But that was not included above to keep calculations simpler.