Trading futures calendar spreads is a good way to express a long or short opinion an underlying index or commodity, without the volatility and margin requirements of a fully directional naked future contract. We are using Interactive Brokers (IB) to trade future calendar spreads, but many other future brokers offer this. Here we can review an example Natural Gas /NG bullish calendar spread, that should benefit from a rise in the commodity price. This bull future spread means long a front month future contract, and short a back month future contract.
To describe trade entry and exit on this bull future spread we will use the IB “buy” and “sell” terminology as follows:
Trade entry – means to “sell” the spread (go long front month, then short back month)
Trade exit – means to “buy” the spread (short front month and go long back month). This is the exact logical opposite of trade entry.
Futures Calendar Spreads – Demo Account
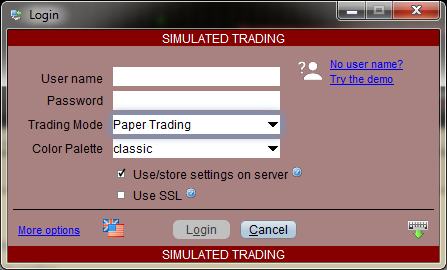
Before you place any real trades here it is highly recommended use the IB demo trading mode of Paper Trading. Click “Try the demo” link below from the IB login screen. The IB future trading interface is somewhat non intuitive and requires a reasonable learning curve to fully understand what futures positions are being represented.
Trade Entry
Trade Entry was on 27th Feb 2018
These are screenshots of entering the order from the demo system. Using the demo system for dummy order execution avoids accidental executions with “real” money. Please note that the market has moved so that the demo system screenshots do not match the above “real” trade entry executions – however the process to follow remains identical.
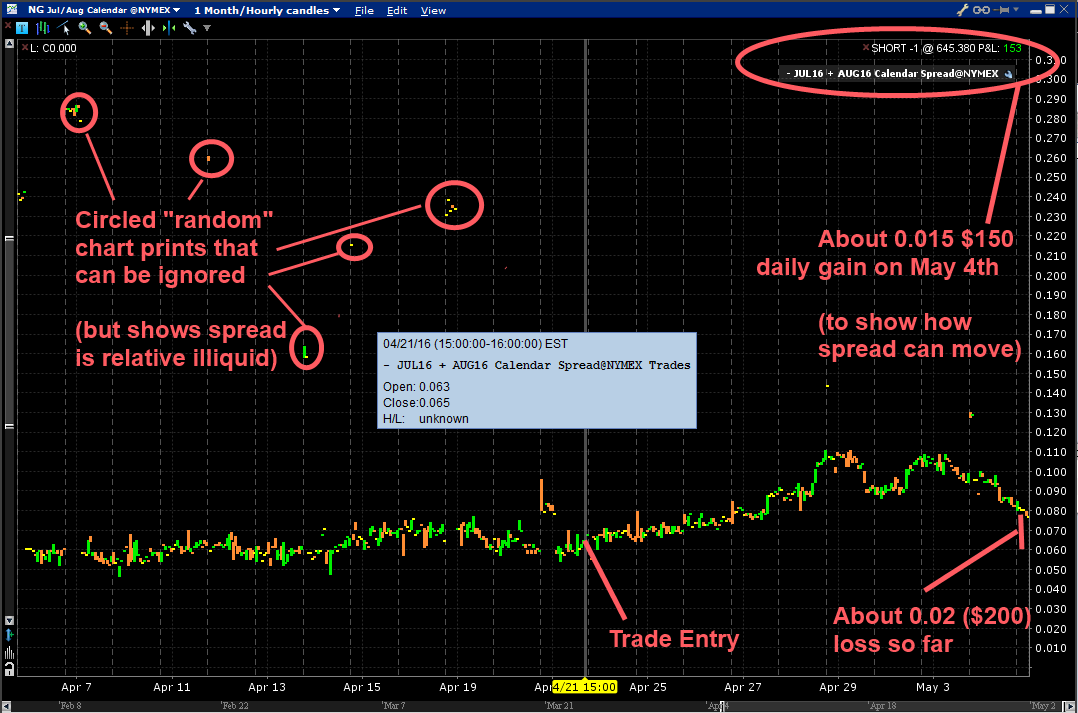
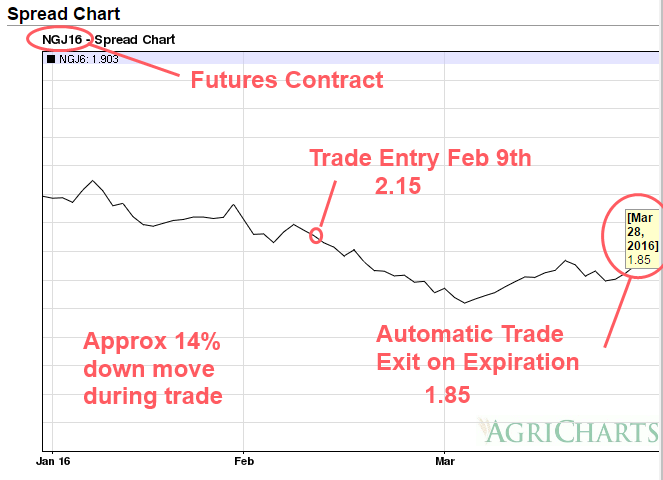
For some historical context, this is the 1 year chart of the spread:
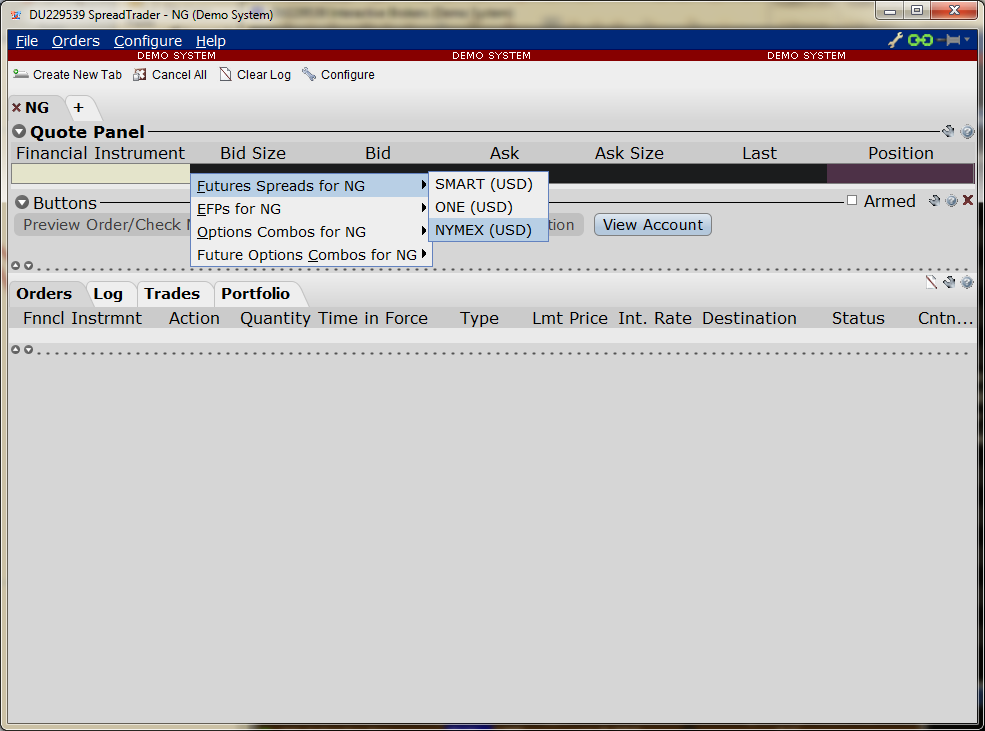
This is where to select the relevant menu item from the SpreadTrader utility:
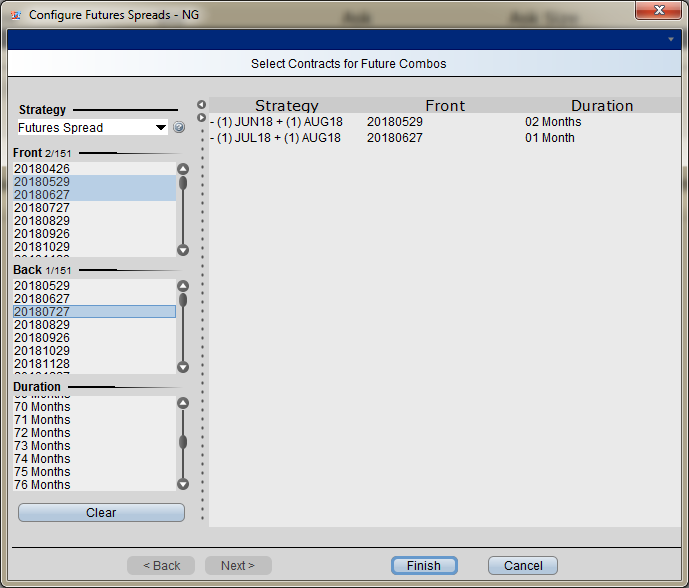
This is how to select the front month and back month. Importantly can not select just one calendar spread, must select two or more spreads otherwise the “Finish” button does not appear.
Click on the relevant “ask” for the calendar spread and the following order entry will appear.
As we are selling, make sure the limit price starts higher than current Ask.
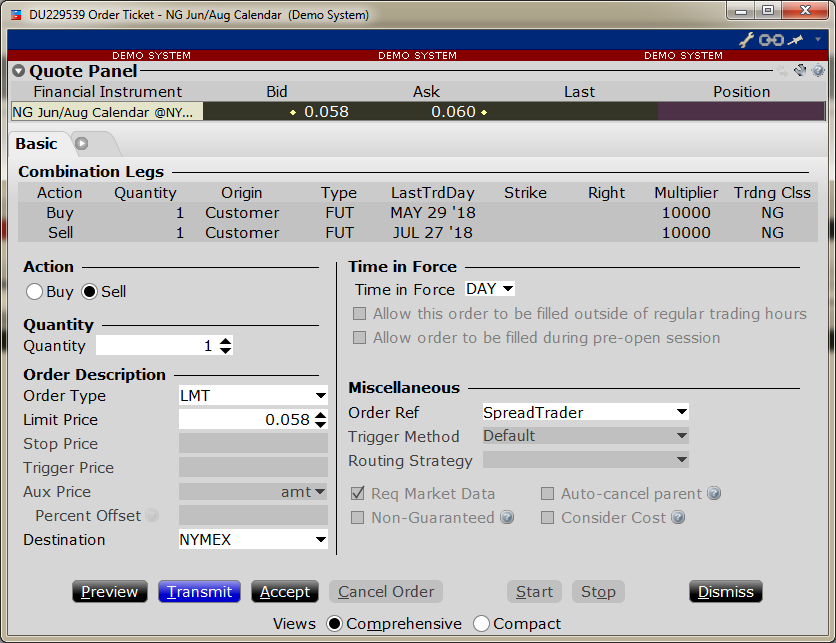
Followed by this order display:
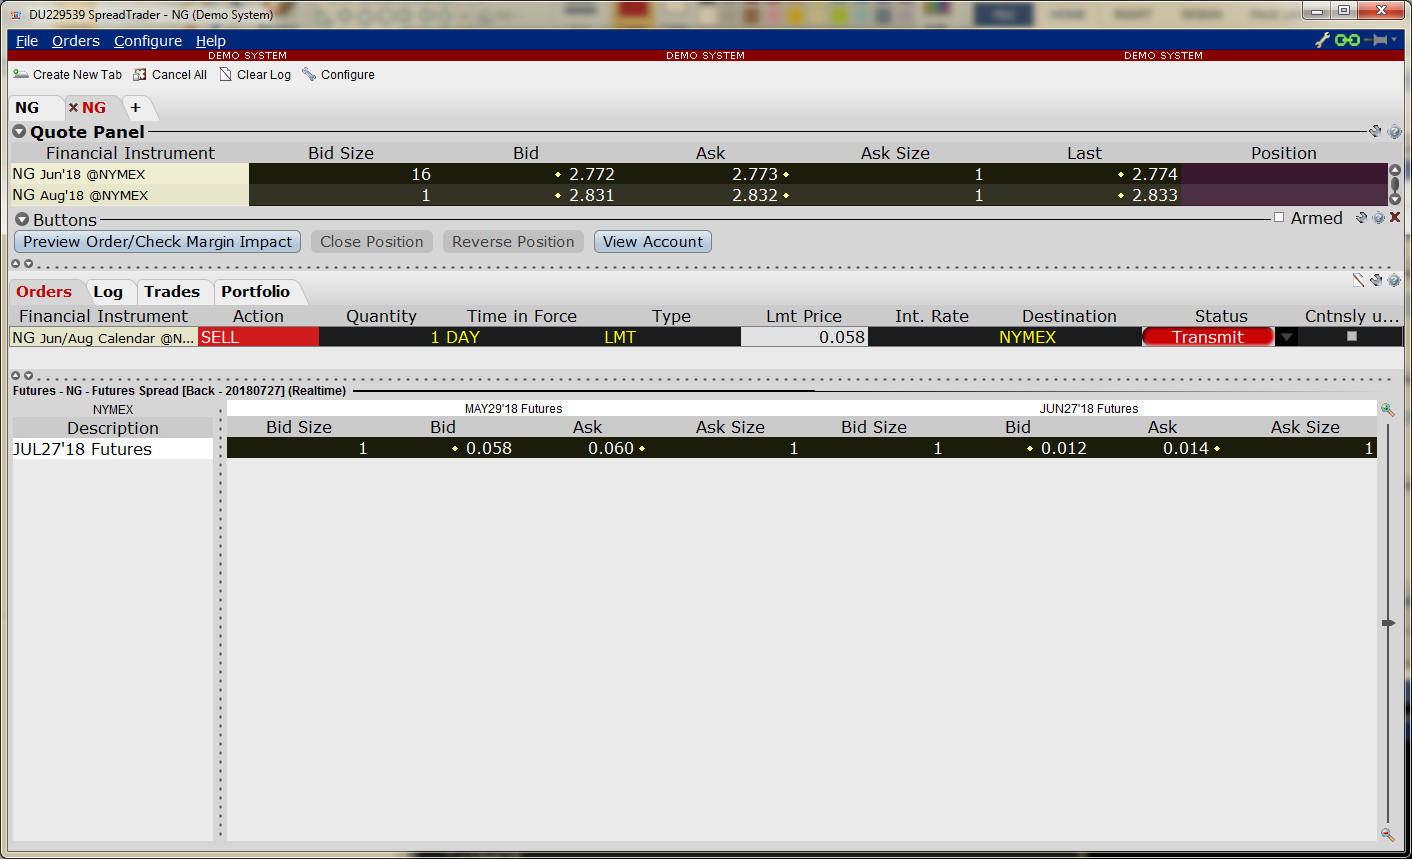
Walk down the limit price downwards (because we are selling) by 0.001 increments on the order until you achieve a fill.
Trade Update
This trade update was on 18th April 2018 to enter a GTC order to allow possible trade exit after the time frame for the 30 day rule has elapsed.
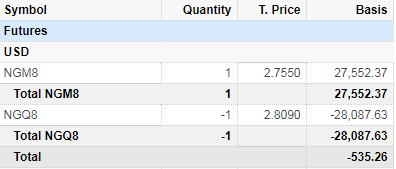
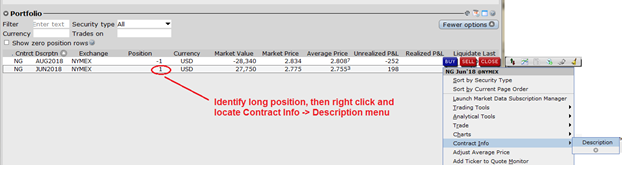
Identify the long future leg in the front month from the Account Positions, and select Contract Description menu:
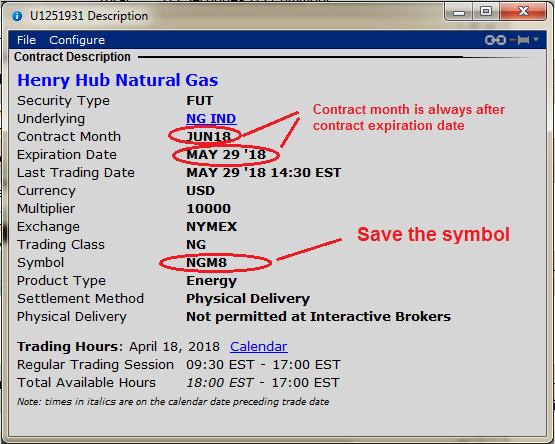
Review the contract description and note the symbol. In this case the symbol is NGM8. Verify that the futures contract named month and actual expiration date are as expected.
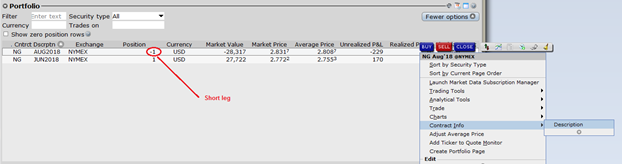
Repeat process for the short future leg in the back month from the Account Positions, and select Contract Description menu:
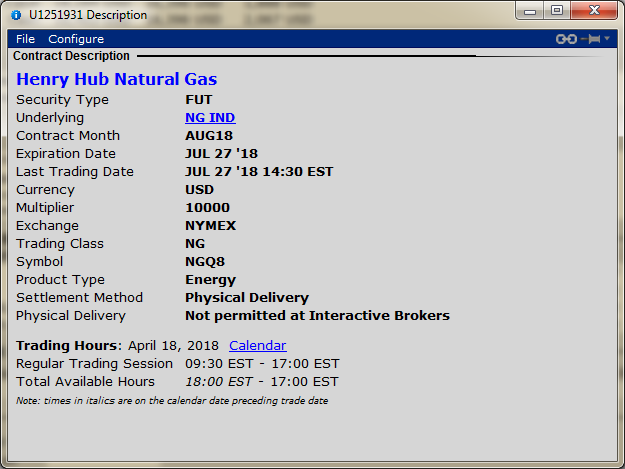
Review the contract description and note the symbol. In this case the symbol is NGQ8.
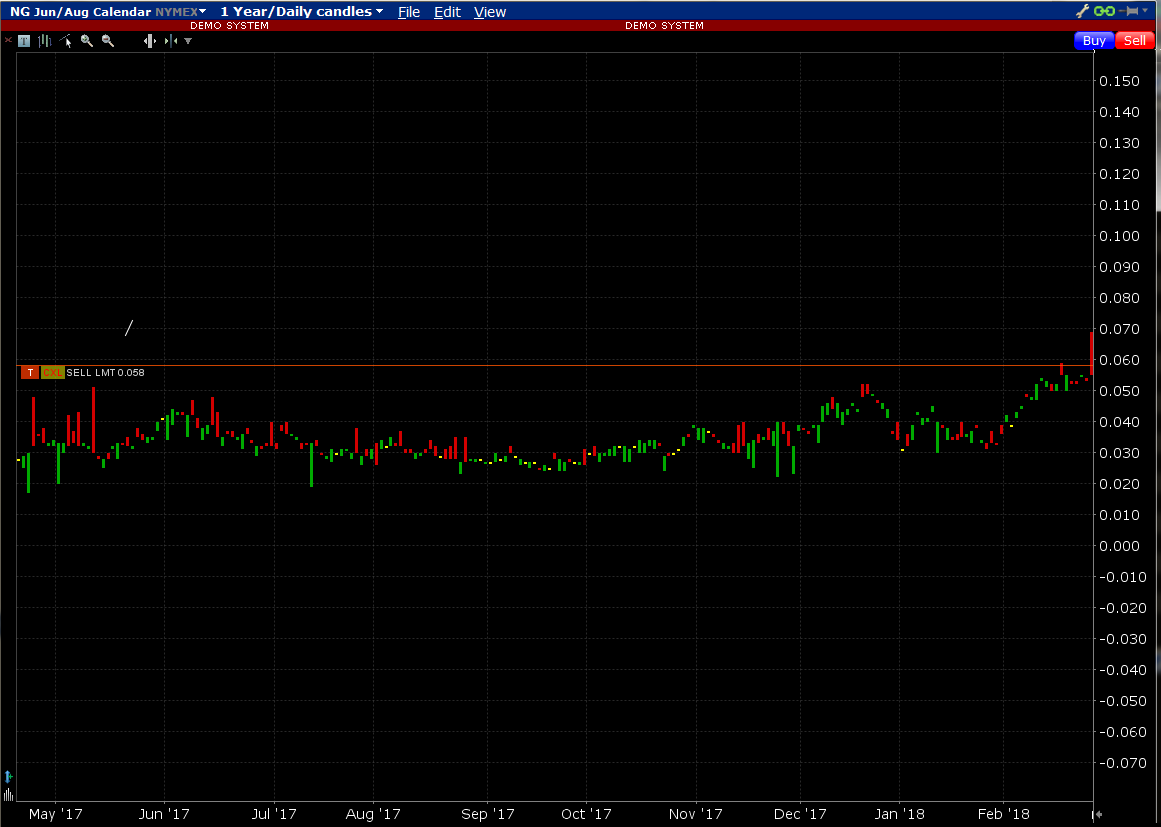
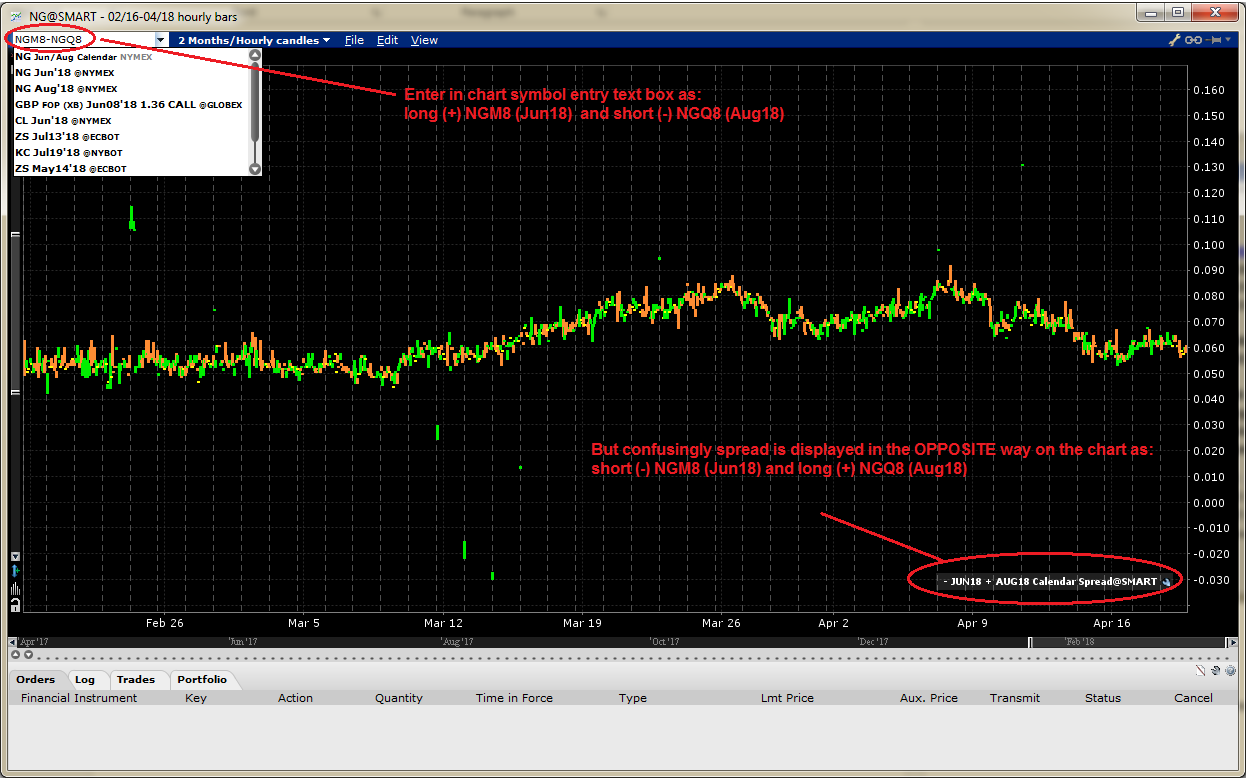
Now look at the chart to identify a target exit price. Create a new chart of the calendar futures spread that is the long near month contract minus the short back month contract
Cut and paste NGM8-NGQ8 into the chart symbol entry text box and press ENTER. In this example NGM8 Jun 18 is the near month and NGQ8 Aug 18 is the back month.
Important – note that the label shown on the chart is the exact OPPOSITE way to what was entered!
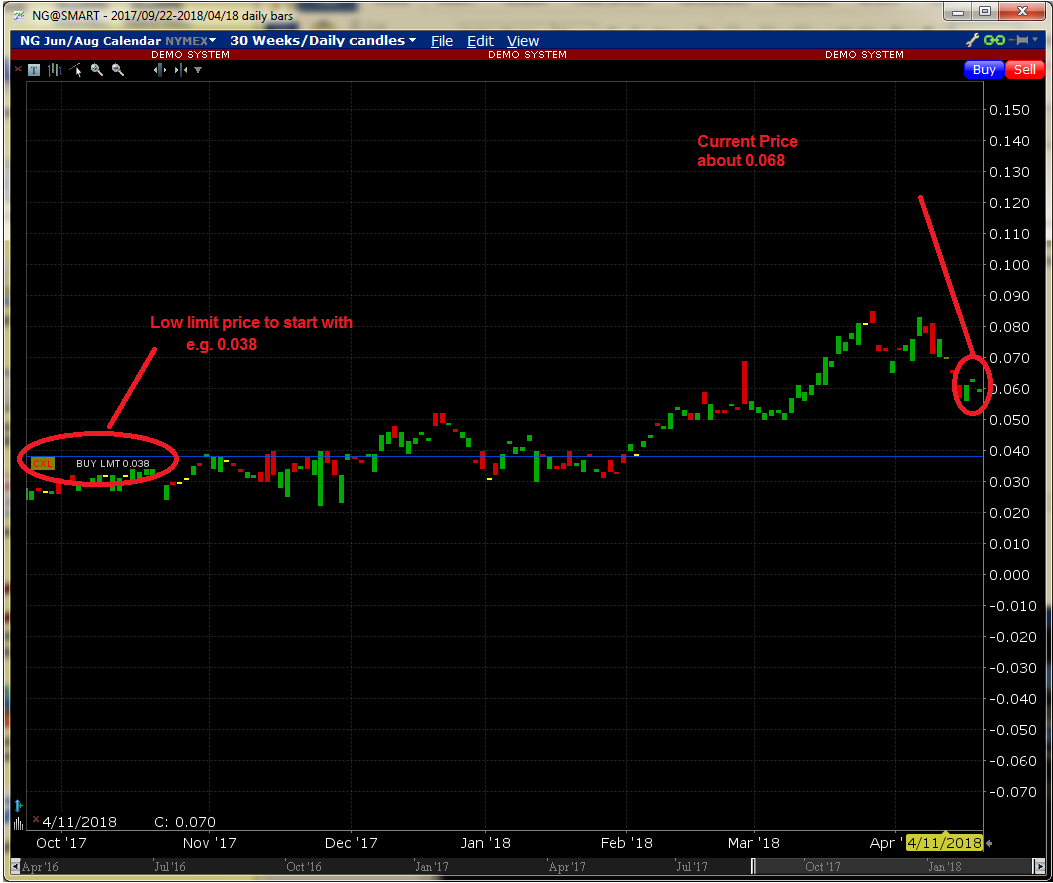
Now create limit order exit trade to Buy. Right click on the chart and select Buy and drag down the line significantly underneath the chart. Click the “T” on the order.
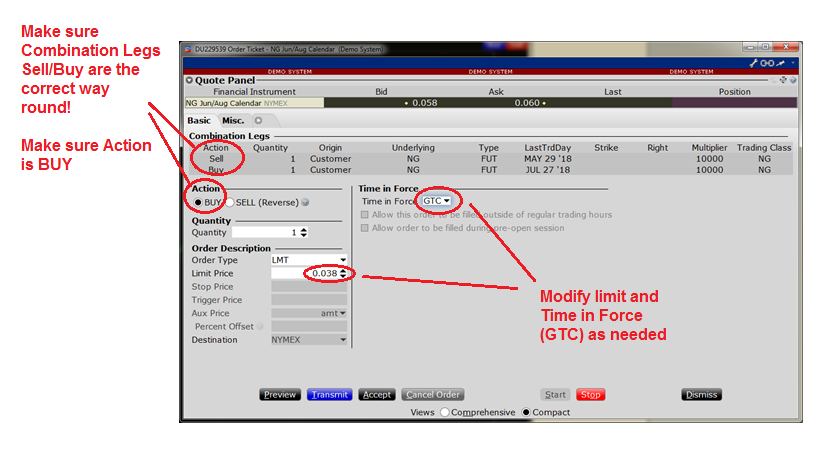
To exit this trade need to sell the near month (that is long Jun 18 position) and buy back the far month (that is short Aug 18 position). IB defines this exit trade as a Buy 1 Calendar Spread. Since we are buying, start limit order with a low limit price, so that it can be cancel and corrected (updated) multiple times to achieve a better price. In this example started at 0.038. See the screenshots below for an example order.
Order Entry:
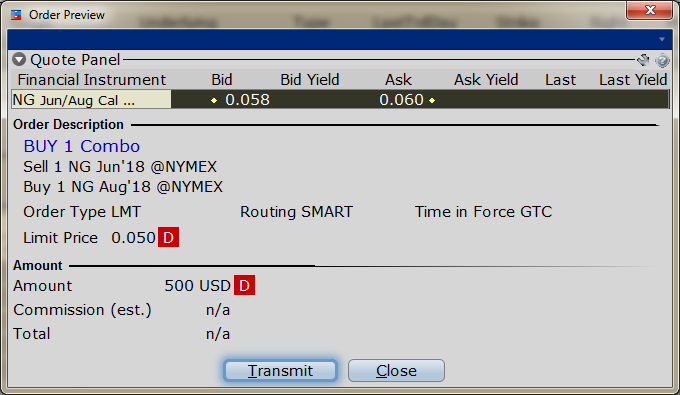
Order Preview:
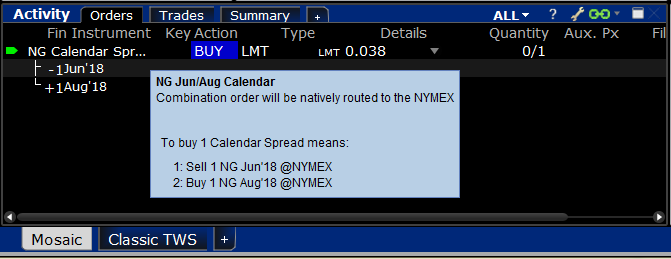
Active Orders:
Trade Summary
Looking at the chart, trying to achieve the lowest price makes sense, as we wish the difference between the near month Jun 18 and far month Aug 18 to shrink not expand. This can be a good til cancelled (GTC) order that can be hung out there until a price target is achieved – historically there seems to be support at 0.040 to 0.030 range, so that could be a good starting target (but you can obviously adjust for your trading style). If you want to get an immediate fill on a trade exit today, then just cancel and correct the order in 0.001 increments until it fills. Alternatively you can leave the order out there for the trading day to see if anyone nibbles at it, then get more aggressive on closing it nearer the end of the day.
In theory most futures calendar spreads are mean reverting, so we are looking for a move back towards the long term mean to capture some gain. We are not looking to make a killing on the directional trade – even though this is a “long” natural gas trade it usually a pretty slow moving spread. Additionally the spread may only go into that range for a few hours or days during its remaining trade lifecycle into end of May expiration, so we just want to grab a good price with a GTC if it’s there. Also we don’t want to hang around for the unpredictable spread volatility for the 2 weeks or so prior to expiration, so if it is still open at that time we’d probably just close when it gets too close to expiration.