This Jan 2022 update explains the hedging and ultimate exit for all our Natural Gas position in UNG ETF. The original trade was started in March 2021 approximately 10 months ago. Recall from our previous Nov 2021 update we had added option trade overlays that take advantage of the higher option volatility on the Natural Gas ETF (UNG). These all expired worthless, leaving the underlying ETF position and ITM call options.
Natural Gas Exit 2022 – Hedging
Hedged entire position on 1st Dec 2021 (around $14) with 100 contracts at $13 put into Jan 2022. This was important because it enabled the UNG position to be held with huge down move to around $12 throughout Dec 2021 with the ultimate recovery back up towards $16 in Jan 2022. Throughout most of Dec 2021 UNG was in a range of between $11 and $13 with little movement outside that relatively tight trading range. This month long trade range was usually given the previously directional trending UNG price for the last 6 months.
Although the $13 put Jan 2022 hedge was ultimately a money loser, it did enable the position to be hedged towards the end of the huge downdraft from $20 (Oct 2021) to $12 (Dec 2021). Ultimately enabling exiting with the overall UNG position with a profit in Jan 2022. Just because the hedge doesn’t make you money, doesn’t mean it is useless – the overall position of underlying, plus any hedges, is the main consideration.
Natural Gas Exit 2022 – Sell Longs
Sold majority of long exposure on Jan 12th 2022 in two main trades during a large price rally up to over $16. First selling the underlying ETF 5000 UNG at $15.35 in the morning. Second selling the 50 long ITM Call strike $11 Jan 2022 in the afternoon for $4.98 (with UNG at about $15.99). This gave an average share price exit of about $15.67 on Jan 12th. The deep ITM calls were due to expire the following week and were trading like stock (about 99 delta). Therefore it is appropriate to use their sale price (with the UNG ETF position as well) to calculate an average exit price for the overall position. Looking at the 5 day chart for the week 10th to 14th Jan 2022 shows that this trading ended up being some of the best pricing for the week.
The position was exited quickly (all on the same trading day) when the opportunity presented. This was because half of the position was in deep ITM calls that were going to very likely be assigned (with an $11 strike) on January option expiration on 21st Jan 2022. It is hard to time the exact top in a market that aggressively moving higher, but on this occasion it was traded well this week.
Natural Gas Exit 2022 – Spreads
After most of the long deltas were sold, still need to sell remaining spreads in final week of Jan 2022 expiration. To further complicate matters this was a short trading week with only 4 trading days from Tues to Friday (because Monday was a trading holiday). The positions held on 18th Jan 2022 at start of trading week were 1) a bull call spread long $16 and short $18 expiring 21st Jan 2022 and 2) a bear put spread long $13 and short $11 expiring 21st Jan 2022. These options were the last remaining UNG positions in spreads only, so was much lower risk that long deltas previously held. The expectation was that there would continue to volatility in the final expiration week and that would generate an outside move in either direction. To make some money on at least one of these spreads, then UNG had to move quickly in either direction and not stay in a range. As it happened the market crashed down and on 20th Jan 2022 at under $13 the $13/$11 bear put spread was taken off with some time value remaining to extract at least some value from the hedges (rather than zero by expiring worthless in a few days). The $16/$18 bull call spread was a full loser.
They was no obvious catalyst for an extreme move in either direction after option expiration on Jan 21st, because presumably this cold spell would be short lived. Therefore no new option positions were rolled or started. Additionally holding UNG long term is typically not a good long term multi year trade due to in built ETF decay, and this position has been held for about 4 months so far (which would likely include some ETF decay). Since there was no desire to maintain a UNG position into the rest of 2022, then all positions either expired or were taken off – leaving no open positions after 21st Jan 2022.
Natural Gas Exit 2022 – Future Idea
There was one potential strategy that wasn’t used at the time, but that could be useful in future. However this can usually only be considered when the call put skew is 2:1 on call side – as was the case in the large price spike into Oct 2021. Since the equivalent OTM call premium was twice that of the equivalent strike OTM put premium, then it was possible to sell 1 call and buy 2 puts for an even money collar. For example in Oct 2021 with UNG at $20, could have hedged with short 1 call Dec 2021 strike $24, but long 2 puts Dec 2021 at strike $18 – all for even money.
That gives an interesting risk profile:
If the market goes up a lot then that would still have given decent upside potentially, obviously capped out at the short call strike.
If the market stays in a range, then ultimately the 1 x short call and 2 x long put would lose value and ultimately expire worthless. With hindsight, this would be equivalent to holding the position without any hedges – but obviously risk management on larger positions is important to preserve capital – did not KNOW that this would be the case in advance.
If the market goes down a lot then importantly money could be made in an extreme crash – because the doubled up puts actually make the natural gas position to go net short the lower UNG prices goes. This works because even though the underlying UNG ETF position (with a delta of 100) is declining, having double the number of puts means their negative deltas can more than offset the underlying position. For example if UNG was at $15 then the deltas on the doubled up puts would be approximately 65 delta + 65 delta = – 130 delta. Since the UNG delta will always be 100 delta, the overall position would have a delta of 100 (underlying) minus 130 delta (double puts) – for a total of about negative 30 delta. This is what actually happened with a move down towards $12 in Dec 2021.
So with hindsight this 2:1 collar would have been a great strategy to participate in the upside and the downside. Especially when the Natural Gas market expectation was significantly higher prices in the next month (high OTM call premium), but where history shows huge crashes over a few trading sessions are possible (look at any multi year historical price chart). If this situation presents itself in future, then the 2:1 collar strategy is one we would definitely consider.
Natural Gas Exit 2022 – Summary
Using some hedges (such as the $13 put) allowed us to maintain the position during the dip down to nearly $12 (and lower) in Dec 2021. This would have been very poor risk management to maintain that size of position without a hedge, even though in the end would have made more money without the hedge. The ultimate exit was quite fortunate as were running out of time with Jan 21st 2022 option expiration less than 10 away. There was a huge futures price spike due to storm and cold spell that enabled a swift and profitable exit. However in Oct 2021 this could have executed or hedged at around $20, so this did “leave” about $4 of UNG “on the table” (or about $40k) with better trading. In summary made about 200% but could have made 500% with better trading.
This Bonfire Night update on our 2021 Natural Gas (NG) position trade explains why our existing NG exposure is being maintained even though the price has run up a lot. We will discuss how the seasonal factors and option pricing skew have persuaded us to add to the position trade and hold through Winter 2021. However due to the high price rise, we will only be adding option trade overlays that take advantage of the higher option volatility on the Natural Gas ETF (UNG). If UNG runs higher then these new option trades will make money up to a target strike – but if UNG stays the same or sells off then they will expire worthless.
Natural Gas Winter 2021 – Existing Position Trade
The existing NG position has already been quite profitable. To recap the existing position trade has two main parts 1) 50 contract Aug/Sept calendar spread – that is short $15 Aug 2021 and long $15 Sept 2021 pair for total cost of $0.22 and 2) 50 contract long underlying LEAP call Jan 2022 $11. See the previous long natural gas since Q1 2021 post (from July of this year) for all of the background to how these UNG positions were traded starting in March 2021 . Anyhow as luck would have it, in August 2021 the NG market pulled back and allowed the short UNG Aug $15 call (the short call in the calendar spread) to expire worthless. Fortunately the market rallied back strongly in Sept 2021 because the only remaining position from the calendar spread was the long Sept $15 Call. This call ended up $2.65 ITM with UNG $17.65 on Sept 17th. This meant that there was a market enforced trading decision to make with following possibilities:
1) Sell to close $15 Sept 2021 call for an immediate profit.
2) Roll into another call in a future month (e.g. Dec 2021 or Jan 2022) further out in time. The term “Rolling” here means sell to close the existing call, then buy to open the new call.
3) Deliberately get assigned UNG at $15 and create a new ETF position
Normally we would consider the original Aug/Sept calendar spread as one self contained trade, and simply close for a nice profit (option 1). However we decided to push the envelope, and keep UNG trade on since it was acting very bullish. Hard to know where the top is in a strongly rallying commodity. Commodities can tend to have blow off tops, when supply/demand move to extremes. This isn’t obviously a guarantee for a similar blow off top high in NG, but the chart pattern is similar. historically NG can rally very fast. So on balance decided to maintain the larger position.
The issue with maintaining position was that option volatility was very high. This meant that rolling (option 2) would have required purchasing $2 or $3 of pure time value to roll to similar $15 strike in Jan 2022. So rolling long calls when volatility is that high is not desirable, even if it is more capital efficient (than just buying the ETF outright). UNG would need to rally about 20% by Jan 2022 just to break even.
Therefore decided to go with getting assigned at $15 and creating a new UNG share position (option 3). Deliberately did nothing until Sept 17th expiration Friday, then as UNG closed over $15 our account got assigned on 5000 shares UNG. As a reminder – one option contracts controls 100 shares, so 50 contracts x 100 shares = 5,000 shares. The trade was already in the money with some profit, so that gives some buffer before losing money on the actual ETF position (if UNG were to pull back). However this requires using $75k cash to buy 5000 shares at $15. The brokerage will assign ITM calls automatically, so on the Monday after expiration will be long 5000 UNG shares. This did not require purchasing any time value with options because a stock or ETF position has no time decay (no theta value). Sometimes it is “ok” to use ETF (or stock) to compliment the overall position, specifically because ETF positions don’t decay with time. It also allows selling options against the stock to bring in some time value.
The overall position is now 5000 UNG and 50 Jan 2022 $11 calls. This combined position has a delta of nearly 100, because the Jan call is so far ITM it is trading almost equivalent to a stock or ETF position. Stock or ETFs always trade with a delta of 100 because they are the actual underlying for any derivative option (and have no time decay). Therefore the overall UNG position here is almost equivalent to 10,000 shares. The average price of the new long UNG 5,000 shares is about $15.22 (including the profit from the expired short Aug call). The average price of the Jan 2022 $11 call was $0.94 so UNG can pull back to about $11.94 before that starts losing money. For simplicity this ignores any time embedded value in the call – in reality there would always be some time value in the call – unless it was the final trading hours into Jan 2022 expiration. Getting back to estimating the breakeven point – this gives us an approximate break even point of $15.22 + $11.94 / 2 = $13.58 for this unrealised long UNG position. This is a very aggressive position sizing, however this is an example of pyramiding into winners – which we are trying to do as improved trading discipline (but it is surprisingly hard to do). We are hoping to get a market top at higher prices, and are willing to let the underlying unrealised profit thrash around. Hopefully it will go higher, because the trend is up. Keeping one very successful unrealised profit trade open is very hard to do physiologically. The pull backs always feel difficult to hold through, because always pricing relative to the latest price peak. For example, “if we’d sold last week, now we’d have $20k more than today”. The issue is that if you sell before a big move is fully realised, then you likely aren’t getting back in – no matter how good your technical analysis is at identifying top and bottoms. We are attempting to apply the trading logic from Reminiscences of a Stock Operator – “The big money was not in the individual fluctuations but in the main movements – that is, not in reading the tape but in sizing up the entire market and its trend.” and “It never was my thinking that made the big money for me. It was always my sitting.”. There is no guarantee that NG will hold up and has a history of huge sell offs, however if don’t hold then are foregoing possibility of very large gains.
Natural Gas Winter 2021 – Call Volatility Skew
In additional to the winter seasonality advantage, the overall position trade is being maintained partially because the near term options skew to the upside. As NG is entering into Q4 2021 there is significantly implied volatility in near month options indicating that potentially a much higher price move is still quite possible. Additionally there is currently an incredible call option upside skew, when compared to put options.
The following is the Dec 2021 UNG option chain on 26th Oct 2021:
With UNG at $20.40 comparing the 30 delta calls and puts for Dec 2021 (53 days time) shows a huge call skew. The option market thinks that UNG has a 30% probability of closing at $18 to downside ($18 put with 0.3067 delta) or $32 to upside ($32 call with 0.2970 delta). To put this another way – UNG options were implying in 53 days time that a $2.40 move lowerhad the same 30% probability as an $11.60 move higher. That is a 4.8 to 1 upside skew in calls versus puts at the 30 delta option! This level of skew is not normal, so we may be able to structure some short option strategies to take advantage.
Since the main position trade consists of long stock and deep ITM calls, we can change option strategy to take advantage of high volatility. Additionally would like to be greedy and make even more if UNG rallies into winter 2021. However do not want to add significantly more capital into UNG. Therefore will look at very wide 2:1 ratio call spreads, partially financed by way OTM short puts.
Both of these high volatility option strategies are available with option legs a long way OTM because UNG volatility is over 100%. As the following 1 year chart of UNG volatility shows – implied volatility has been over 100% at some points in Oct 2021, peaking around 120% in early October with a low point of around 90% in mid October.
The trade construction is Buy 50 contracts of a call at high OTM strike, then sell 100 contracts at even higher strike. This a 2:1 ratio call spread is called that because the number of call contracts at the higher strike is usually double the lower strike – in this example a 100 contract: 50 contract ratio call spread. The 2:1 ratio call spread is typically placed for small credit or debit, then idea being to get the 100 contracts sold to approximately pay for the 50 purchased contracts. It can be hard to find match the exact strikes for an even money (no credit or debit) so often there is a small debit or credit.
To help pay for any debit incurred and to maintain a small positive theta (time decay) in the position, we will also look to sell an OTM put for a small credit. The 2:1 ratio call spread is better added as a compliment to an existing bullish ETF position in a high volatility environment because the strikes can be placed further apart. The further apart the strikes, the more profit potential.
For example this trade was done in the Nov 19th 2021 option expiration cycle with long 50 call contracts at $30, short 100 call contracts at $38, and short 50 put contracts at $13. Note this option structure means that have to deliver 5000 shares at $38 because of the extra 50 contracts short – however this is fully covered because we already own 5000 shares.
This was repeated on Dec 2021 option expiration cycle with long 50 call contracts at $28, short 100 call contracts at $38 and short 50 put contracts at $12. This option structure was also fully covered because we already own the 50 call contracts Jan 2022 at $11. Should UNG reach $38 at Dec expiration we would be able to deliver the 5000 shares (via the 50 contracts of the Jan 2022 calls).
These are covered positions on the upside, but with an another important kicker. If UNG closes over the $38 at Nov expiration, then profit would be equivalent to a close at $46. The embedded call spread (long $30, short $38) would be worth $8. So having to deliver ETF stock at $38 (from the $38 call), would be give an equivalent exit price of $38 (short call strike) + $8 (embedded call spread max value) = $46.
This logic would also repeat for Dec. If UNG closes over $38 at Dec expiration, then profit would be equivalent to a $48 closing price. The embedded call spread (long $28, short $38) would be worth $10. So having to deliver ETF stock at $38 (from the $38 call), would be equivalent exit of $38 (short call strike) + $10 (embedded call spread max value) = $48.
If this very bullish scenario were to take place, then it could be possible to maintain the position by do some rolling adjustments nearer to Nov or Dec expiration. However if UNG was massively over $38 it would probably just be simpler to let the entire option structure expire and take the full position profit.
On the downside the short put is cash secured, and is definitely a downside risk that would need to managed if NG drops significantly into winder 2021. This is a possibility, because anything can happen in the market, but not likely. However on trade entry the short put had an 11 delta, which means that it has an 89% chance of expiring worthless at Nov or Dec expiration. A short put trade seems worth the risk, since we are bullish on NG price (it should maintain over $13 by Nov option expiration) and bearish on NG volatility (think volatility will decline from current elevated levels). Short 50 contracts in Nov expiration at $13, and short 50 contracts in Dec expiration at $12. These short put credits help finance the slightly debit for the 2:1 call ratio spreads.
One nuance to the put selling approach is that they are diagonal at lower strikes the further out in time they go. The Dec $12 strike is lower than the $13 Nov strike. This is to allow for market probabilities to play out into Dec (50+ trading days to expiration) and Nov (only 30+ trading days to expiration). There is more time for the a down move to occur by Dec, so it makes sense to sell a lower strike in Dec than Nov. Either way the probabilities are similar, because on trade entry both Nov and Dec short puts were around 11 delta.
As the 2:1 ratio calls and short puts have been held for several trading days, the market has moved down from Oct 20th to Oct 26th. However the Nov short put is now almost worthless. The volatility in the calls has reduced, so that the $38 short calls have made money and more or less cancelled out the loss of the $30 call. This entire structure of $30/$38 2:1 call ratio and $13 put short, should expire for an approx $600 profit – if UNG is above $13 by Nov expiration.
Similarly the Dec structure volatility has reduced, however the Dec options still have some bid, because the chances of UNG being able to move to option strikes by Dec is more likely. These Nov and Dec 2:1 call ratios will be maintained until expiration, as they represent a “free shot” at UNG being over $30 in Nov and $38 in Dec (with no incurred cost). If a price near $30 ever happened the calls would jump to life again, even if they have a very low probability and so a low price today. This is “ok” because the market paid the premium of the lower call for us as they were financed by the 2 short calls – which is why it is a “free shot”.
Natural Gas Winter 2021 – Speculative Butterfly
Since there will be a $30 call held until 19th Nov expiration, we wanted to add a small speculative long, but with low risk. So we bought in the Nov 26thweekly cycle a 50 contract butterfly $24.5/$30/$35 for $0.29 – total cost about $1500. Normally don’t pay for premium, but considered it partially financed by the short puts from the earlier Nov/Dec trades. It is total speculation, but would be more likely to hit (as only 20% OTM on trade entry). The maximum theoretical gain for this new speculative trade is exactly $30 on 26th Nov and would be about $28,500. Sometimes added a butterfly in high volatility as a compliment to an existing position gives something to focus on in the next expiration cycle, while waiting for the main underlying UNG position trade to play out. This gives some entertain while waiting for the underlying UNG position trade to hold into Dec 2021 and maybe longer in Jan 2022.
Natural Gas Winter 2021 – Summary
Natural Gas (NG) price has consistent seasonal drawdowns typically in winter for home heating from November to March. In 2021 there are potentially a sharp spike in near term prices, because of recent inventory dropdowns before coming into the typically higher demand winter season.
A good source of fundamental NG news is naturalgasintel.com. Despite fundamentals pointing to warm weather in Nov, NG is flat for October (albeit with huge amount of volatility in a range). The lack of significant decline in October in the face of bearish warmer weather could be seen as bullish for rest of 2021. The following summary chart shows UNG price action and volatility in context of the last year’s trading:
This was an update on how to lever up the existing LEAP call and ETF position, using options to potentially increase position trade return. The aim is to maximize return from a commodity price spike over the next 1 to 3 months over Winter – this is not a forever long term hold. The trade exit for this will possibly be in Dec (to close year end trading nicely) or maybe by Jan 2022 (for 2022 taxes). Not entirely clear if this becomes a structural bull market for NG in next few years (and we accidentally bought the bottom). More likely scenario is that NG supply is tight and demand is up in winter 2021, so better to sell into any major price spikes in Dec or Jan. The underlying NG future (near month Nov) is around $6, so if there was a spike towards $10 then traders would probably look at double figures as a logical point to take profit. When trading UNG it is important to look at underlying /NG futures because that is where the majority of NG trading is done. UNG ETF does trade in a liquid way, but it is not the entire market. Price targets and support/resistance in UNG will not impact trader sentiment as much as price targets being reached in the /NG futures. In short /NG futures drive the NG market, not UNG ETF. UNG can also experience much more volatile trading days leading into monthly /NG future expirations. So knowing the exact monthly /NG future expiration dates can explain UNG moves.
In summary we are maintaining position trade over many months, and complementing it with option strategy overlays to hopefully boost returns. The intent is to be long into year end and re-evaluate along the way. The position is bigger than usual with “high conviction” . The position has been correct for several months now, so some amount of unrealised profit volatility can be tolerated. the position will likely ultimately be stopped out by short calls meeting profit targets.
Natural Gas (NG) price has been consistently declining due to significant over supply for the last few years. In general there are consistent seasonal drawdowns of NG supply throughout a trading year, usually due to consumer energy demand for heating or cooling. Typically large drawdowns of NG supply in winter for home heating from November to March. However there can also be periodic supply drawdowns during summer heatwaves with energy demand for home cooling.
Natural gas is historically cheap on an absolute basis, but needs a catalyst to justify a longer term higher prices. The historically cheap price is encouraging countries to reevaluate its use. NG is not considered as “clean” as alternative energy being found near oil deposits. However practically energy will have to come from somewhere. As China’s climate change commitments force transition into “cleaner” energy solutions, they need to plug the gap between oil/coal and transition to alternatives like wind/solar. However NG could becomes up to 15% of China’s energy market by 2030 then that potentially increase demand and maintain pricing this decade. Taking the other side of the argument though, the increase in Chinese NG production into 2030 could dampen the NG price further by over supplying the market.
There could be a good decade long position trade here, but history shows that NG has been following the pattern of lower lows for many years. The following chart shows the Nymex natural gas futures price for Aug 2021 settlement. Starting at $8.88 in Nov 2008, down to a low of $2.21 in Feb 2020, followed by the current price with a bounce back to around $4 in July 2021.
Natural Gas (Aug 2021) futures price for last 13 years…
As the commodity price chart shows – it is hard to justify as a long “buy and hold” trade due to this secular bear market. However it’s rapid spikes make it an excellent trading vehicle, with the right timing. Fortunately 2021 appears to have produced a hot summer that has created a natural gas trading catalyst – so there is no need to wait until 2030 to find out how the trade performed…
Long Hot Summer
The main short to medium term factor driving NG prices is energy demand due to higher than normal US temperatures. Natural gas as a fuel has a different trading dynamic to natural gas producers stock (e.g. such as the FCG ETF). Natural gas price tends to trade off near term supply and demand (up to 6 months out), where as natural gas producer stocks tend to trade off medium to long term expectations for natural gas prices (often 12 months or more out in time). Additionally some producers have locked in contracts (“hedged” pricing) – so short term near month price changes don’t impact longer term prices that could be locked in or haven’t moved that much. The /NG futures curve as of July 2021 is an good example of this phenomena:
Natural gas is not a “forever” trade. However the short term market supply issues mean that pricing can potentially spike in the next few months. One of the main trading vehicles for natural gas is the UNG ETF that attempts to track the commodity price. The implied volatility on UNG options is certainly showing that a large move is possible – with implied volatility moving up from about 30% to over 50% in the last month.
However the July 2021 future curve (from Nymex natural gas futures) is implying a return to “normal” pricing in 2022. From a medium term trading perspective, any significant spikes should be used to reduce risk in the next few months.
The July 2021 futures curve is not always the shape of the commodity futures curve. Typically the main ETFs (such as UNG) that track NG have a structural decay problem, due to rolling futures every month. The ETFs do not hold natural gas as a raw commodity because of storage costs, so they maintain exposure using futures. Usually the ETFs futures holdings are near month to get as close as possible to the commodity spot price. However maintaining this position requires the consistent need to “roll” every month, usually when the near month future gets close to expiration. Rolling means selling the expiring near month and buying the next months future contract. This generates transaction costs every month, but more importantly roll costs can eat away at the capital in the ETF. The next section explains this roll cost in detail.
ETF Roll Cost
More importantly though for the Natural Gas ETF is whether commodity pricing is in contango. Contango is where the price of commodity contracts further out in time are more expensive. Futures prices out in time by many months are sometimes referred as “out on the curve”. The following graph that show an example commodity pricing curve in contango. This example is not for natural gas, so the exact numbers and dates are not that important – it is just a sample contango futures curve to show the idea.
Example contango curve (prices higher in the future)
Contango pricing plays an important part in the long term Natural Gas ETF (UNG) price. UNG typically holds near month Natural Gas futures to approximate the natural gas price. The near month futures contract is normally natural gas for delivery in the next 30 days or less. As the near month contract gets closer to expiration, the fund must roll into the next month’s contract to maintain exposure. If this is not done then the near month contract would expire, and the ETF would acquire several hundred million dollars worth of physical natural gas for delivery! Depending on the funds specific mandate, the “roll” may be done over several days and likely several days prior to expiration. The “roll” is a monthly process to maintain the price exposure.
Using the futures symbol for Natural Gas \NG the following example shows a roll between two separate months. The exact date and pricing shown is not as important as demonstrating the concept. For example if \NG August is $3.50 and \NG Sept is $3.55, then the fund has to sell $3.50 and buy $3.55. This generates a “roll cost” of $0.05 per month (difference between $3.55 and $3.50) just maintain the position. Additionally due to the higher price of the new purchased futures contract, the total number of futures contracts held by the ETF gets reduced. This price difference maybe relatively small (e.g. less than 1.5% of the fund) however compounded over time every month it adds up. This roll loss explains UNG terrible long term performance – as well the actual physical natural gas price trending down.
This chart dramatically shows why UNG is not a “buy and hold” investment, down more than 99% since inception:
UNG – not the best long term investment…
It is important to note that the opposite condition to contango can assist the Net Asset Value of the ETF. The reverse of contango is called “backwardation” – when futures prices out several months are less expensive than near month futures. Backwardation helps the ETF maintain value and only contango has the rolling issue above.
Avoid Buy and Hold
Commodity ETFs like UNG or USO that are often in contango and use near month futures to track the commodity price, should not be held for long term trades. They are tradable for daily or monthly trends, but not usually years.
The other important thing to note is that commodity ETFs using futures don’t always rebound after big crashes. Often contango rolling impact is greatly increased after a crash due to market dislocations in the front month. One extreme example has to be this year in April 2021 when the May Oil price briefly traded at negative $40, but month further out were positive (massive contango). They also do not track the underlying commodity price accurately over a number of years.
This can be shown very clearly when comparing two ETFs that track the oil price using futures – USO and USL. Although both ETFs use futures, USO typically tracks only the daily changes in the near month oil future. USL tries to track the daily changes in the near month to 11 months out (from the near month). That is the average price for all futures contracts in the next year, not just the next month. Since the oil price is often in contango, USL will track it much closer than USO. The following chart shows the huge difference in performance, that can be clearly seen around April 2020 during the “negative oil” futures incident (USO is blue and USL is yellow):
Understanding the futures curve shape and the average duration of the futures held inside an ETF is important before placing a trade.
Trading Position
Options that have over 1 year to expiration are called Long-term equity anticipation securities. They are often abbreviated to “LEAP call” (for calls), “LEAP put” (for puts) or “LEAPS”(for any option either calls or puts). UNG OTM LEAP calls cost a relatively small amount, but can control large position sizes. Depending on how far OTM there is a higher probability (say 60% to 75%) that they lost value slowly over time. However they can only lose the entire premium paid for the position. But if natural gas spikes higher they can quickly go ITM and trade with much higher deltas. They therefore have a great asymmetric risk to reward profile, especially if started during low volatility. They are likely to fail, but if they win they can win big.
On trade entry by definition OTM leap calls will ultimately expire worthless more than half the time (if they were held all the way to expiration. This is because they have a delta of less than 50% on trade entry. When a LEAP call is losing money any residual value for the decaying option can reclaimed by selling at 50%. For example, if originally bought Jun 2022 $12 calls for $1.5 then could sell after it has decayed to $0.75 to maintain some value. Another approach is simply to position size appropriately for the portfolio and let it expire worthless (having already accepted the full risk as part of the portfolio). Alternatively can roll out in time to further six months if want to maintain the position. Our approach is normally to exit position and maintain some value if not working or roll out in time. Don’t normally let the LEAP go all the way to expiration.
To manage upside we would typically take some profit off the table at 100%, if reached in short order. For example, consider buying a LEAP more than 1 year away for $1, then after a price rally selling half for $2 two months later. This means a zero risk trade for remaining 10 months of the option lifetime. The position is now half sized, so will not make as much potential profit. However half sized position can now be allowed to run for many months to see how it does. Since this example position contains no risk it could be allowed to run almost to expiration to see how it does. Unless the calls are very deep ITM (low time value) should consider rolling or selling with 60 to 30 days to expiration to avoid option decay.
Implied Volatility
Paying attention to implied volatility (IV) on trade entry for LEAP calls is important to maintain trade value. Since LEAP calls are sensitive to increases in volatility, rising volatility can provide a trade profit even if the underlying does not move that much. The important IV measure is not just the absolute percentage (%) as “high” (e.g. 50%) or “low” (e.g. 10%). The measure used for trade entry is the percentage (%) relative to the recent IV historical trading range (usually 1 year). Ideally LEAP calls are bought when IV is towards the low end of its annual trading range. For example, assume an IV trading range for the previous of year of 9% to 20%. Buying when UNG IV is 10% would be buying at the bottom of the volatility range. Once the trade is on, looking at option vega will show how much the option would increase with a 1% move higher in volatility (all other variables being equal). It is quite possible to see a significant % profit in a LEAP call if volatility rises quickly. Importantly LEAPs trade on expectations for future volatility at option expiration not on for expectations for the next few days or months. Although short term and long term volatility are usually correlated they may not necessarily move with the same magnitude. A short term spike in IV may not move IV in longer dated LEAPs. For example, a natural gas supply crunch that will likely be resolved next month, may not move option pricing in 12 months because the market expects it to be resolved by then.
LEAP calls are not “buy and hold” trades and so do require monitoring and risk management. Holding the LEAP call only can be a valid strategy. However over the long term selling calls mechanically or dynamically can improve returns and risk management. Selling calls does limit the theoretical unlimited upside, but on average it improves and smooths out returns. Selling calls does not have to be done against the entire LEAP call position, so with some strategies the theoretical unlimited upside can be maintained.
Selling Calls Mechanically
Another form of risk management is selling calls against the long LEAP call. This can be done ATM to try and exit position, but still get some premiums for next month. Alternatively this can be a scaling out exit strategy, to sell OTM calls next month, 2 months and 3 months out. For example if UNG is at $12, sell the July calls at $13, Aug at $14 and Sept at $15. This should give similar option premiums for each call sold, but gives more time for trade to rise and different time frames to sell calls. There is no role on the amount of contracts to sell, and it doesn’t have to match the long LEAP calls contract. For example if already own 100 LEAP calls, could sell 40 calls in July, 30 calls in Aug and 30 calls in Sept.
Alternatively if would like to exit half position can sell 50 next month ATM, leave the rest of the 50 contracts open. This gives the richest ATM premium that gets kept if position sells off. However if half the position gets called away in the next month cycle, then this still maintains half the position for further unlimited upside (no sold calls to cap the upside).
Repeating this monthly call selling strategies several times a year can help pay for the entire LEAP call. For example selling 10 calls ATM for $0.30 in six separate trades over 1 year would pay for buying a 20 LEAP calls at $0.90. This is a somewhat idealized example, because it assumes that the sold calls expire worthless each time. More realistic is to assume that half of the sold call premium is captured, so calls sold through out the year for $0.30 can on average to bought back for $0.15. This scenario is more realistic because it covers many call selling trading outcomes each month. For example selling 10 calls ATM for $0.30 in 12 separate trades could have multiple exit scenarios – some calls could expire worthless (full $0.30 gain) or need rolling into next month (e.g. buy back for $0.70 with $0.40 loss, then resell next month at $0.30). Taking loses on the sold calls still allows the position to make money, because the long LEAP call also increases in the rising market. However if the market rises too fast then sold calls could be hard to roll, so would be better just to exit the entire position.
Selling Calls Dynamically
Another more opportunistic strategy is to wait until IV increases during the year. This becomes more likely if the position was entered in relatively low volatility. When IV spikes up start selling “junk” options that are say 25% OTM. Depending on the level of the volatility spike these can be sold for between $0.10 and $0.25. Selling junk options for less than $0.10 is not recommended because commissions are a greater % of the trade. Also in a volatile market options that are way OTM but closer to zero (in the range $0.01 to $0.10) don’t decay that fast until very close to expiration – because there is always the underlying “threat” of a price spike.
Occasionally the commodity market presents some incredible premium on OTM options. For example on SLV in March 2021 during the Reddit meme stock volatility spike the IV doubled in a week from around 35% to briefly over 70%. During that week sold several SLV call options way over $0.10 that would normally have near zero value. Their volatility was implying a more than 100% move in silver by expiration in less than 60 days. Of course the options ultimately expired worthless, but also the premium got crushed within a couple of days after the high volatility mean reverted (see chart).
SLV Feb 2021 Implied Volatility spike
High IV in call options tends to revert back to a the mean value, which means that on average it doesn’t typically stay elevated for long periods of time – so was a quick return on investment. This mean reversion is why on average call selling works in higher volatility. Importantly having a long LEAP call covers when the underlying moves outside of the average price range – that is when the sold calls go way in the money at expiration. In the above SLV example, the call selling was always covered (not “naked”) because it was done against a SLV LEAP call that was already owned earlier in the year (and established in lower volatility). Admittedly this is one of the most extreme example from a commodity ETF in the last few years. However consistently selling the “junk” options to compliment a fully covered LEAP call position, can make regular income and still keep the long commodity trade idea alive. There is always the possibility of being “called away” on a huge market rally, but that would be a happy occurrence because the LEAP call would have greatly benefited.
Selling Calls for Hedging
One word of warning on dynamic call selling is don’t sell calls that are at or beneath the LEAP call strike. When beginning a trading position that will sell calls, it is better to sell way futher OTM or not bother selling any calls initially. Sell calls over time is to reduce cost basis in trade – in this case reduce the amount paid for the LEAP call. If that uncertain on amount at risk when starting a new position, then simply trade a smaller position size – don’t over hedge to start with.
When trying to rescue a position where the LEAP call has lost money, do not sell strikes in the near month below the LEAP call strike. This is sometimes called an “inversion” position. This position can potentially lose money if the commodity price increases, which the opposite of the original trade idea. This is because if the near term short option goes significantly ITM it will start acting like short stock – with a delta that trends towards negative one hundred (-100). The negative delta on the short call will be greater than the positive delta on the LEAP call (likely in the range of 50 to 70 delta). Therefore the entire position becomes net short. For example, 70 delta (from LEAP call) minus 90 delta (from deep ITM short call) is minus 30 delta (short position). These deltas are realistic examples for what would happen if the commodity rallied 20% with this “inversion” position (short strike call lower than long strike call).
Short calls are great to generate income or exit a winning trade. however when selling calls only to reduce long deltas (i.e. reduce risk) it is probably better just to sell (to close) some long LEAP call contracts. Selling calls should always be a compliment to main LEAP call position, not exclusively for reducing risk by adding short positions to a long position (hedging). Sometimes the best risk management is just to sell underlying position, not try and over hedge with calls. If the concern is losing all the LEAP call premium, then the position size is probably too large for the portfolio.
Portfolio Strategy
Importantly however the slower time decay of this strategy allows holding the entire position through a downdraft, because there is time to recover the loss. No action is required with correct portfolio position sizing, because the risk is accepted on trade entry. The position size can be 1% to 2% of the portfolio for a “normal” trade, or up 5% for a high conviction position trade. In previous trading experience we found that these LEAP call strategy should not be sized over 5%. This is because the position is still all time value and as such is decaying every day (even though daily decay is small). Additionally the combination of strategies in a portfolio is very important. Should not have an entire portfolio of OTM LEAPs as strategy for all portfolio positions. For example, having 20 distinct LEAP calls each with a position size of 5% would be have unmanageable theta (time) decay. Essentially an entire portfolio of LEAPs would have be 100% time value with no intrinsic value. If running LEAP strategies on a few underlying ETFs, then other portfolio positions should be in short volatility strategies (e.g. credit spreads) to compensate for the daily theta decay.
Trading Update
Trade entry was to go long natural gas in 2021. In March 2021, bought the UNG Jan 2022 LEAP call (10 months out) for $0.94. A few weeks later UNG went down to around $9, and the LEAP was losing money. However there has been a nice rally into July 2021. When UNG pulled back from peak around $13 to about $12.60, exited half the position in case this was the “big one” for a pull back. Natural gas is hard to trade because spike up quickly with a nice profit, then be back to break even 2 weeks later. Obviously as soon as the position is halved, the market rallies – but that’s just trading. Some physiological experience trading cryptos is helpful, because the UNG short term trading peaks and troughs can have similar severity (even though the fundamental drivers are obviously massively different).
UNG Year to date 2021 price chart – including trade updates
To get some extra juice in the trade, sold the $15 Aug 2021 calls for $0.20 against the entire position. The high premium for selling a 15% OTM call option was possible due to high IV. This trade is to tempt the market to try and hit a $15 target in only a few weeks, but also to hedge a pull back.
However as the market rallied again past $13 a couple of days later, realized that had made a mistake on being the start of a big sell off. Therefore was looking keep the long position for potentially higher than $15. This may seem like flipping ideas and being too wishy washy. However UNG looks more bullish then expected and resistance at $13 disappeared quickly. Basically would like to maintain a larger position size, but would like to have finger on the exit button. Also since had just made a nice profit selling half the underlying LEAP, we had the “house money” to do another long trade. So in order to maintain long deltas, bought the $15 Sept 2021 calls for $0.42. This made a calendar spread in the $15 Aug/Sept pair for total cost of $0.22. The calendar spread is in addition to the now half position sized underlying LEAP call Jan 2022 $11.
Trading Summary
This was an overview of how to use LEAP calls and short call overlays to trade commodity ETFs. The aim was to maintain a position, take risk off on the way up, and lighten up towards the end of the trend. Another trading update should be done when the current natural gas position is significantly changed or exited.
Trading futures calendar spreads is a good way to express a long or short opinion an underlying index or commodity, without the volatility and margin requirements of a fully directional naked future contract. We are using Interactive Brokers (IB) to trade future calendar spreads, but many other future brokers offer this. Here we can review an example Natural Gas /NG bullish calendar spread, that should benefit from a rise in the commodity price. This bull future spread means long a front month future contract, and short a back month future contract.
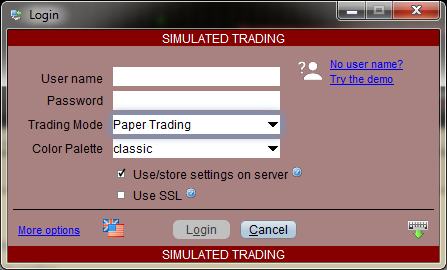
Before you place any real trades here it is highly recommended use the IB demo trading mode of Paper Trading. Click “Try the demo” link below from the IB login screen. The IB future trading interface is somewhat non intuitive and requires a reasonable learning curve to fully understand what futures positions are being represented.
These are screenshots of entering the order from the demo system. Using the demo system for dummy order execution avoids accidental executions with “real” money. Please note that the market has moved so that the demo system screenshots do not match the above “real” trade entry executions – however the process to follow remains identical.
For some historical context, this is the 1 year chart of the spread:
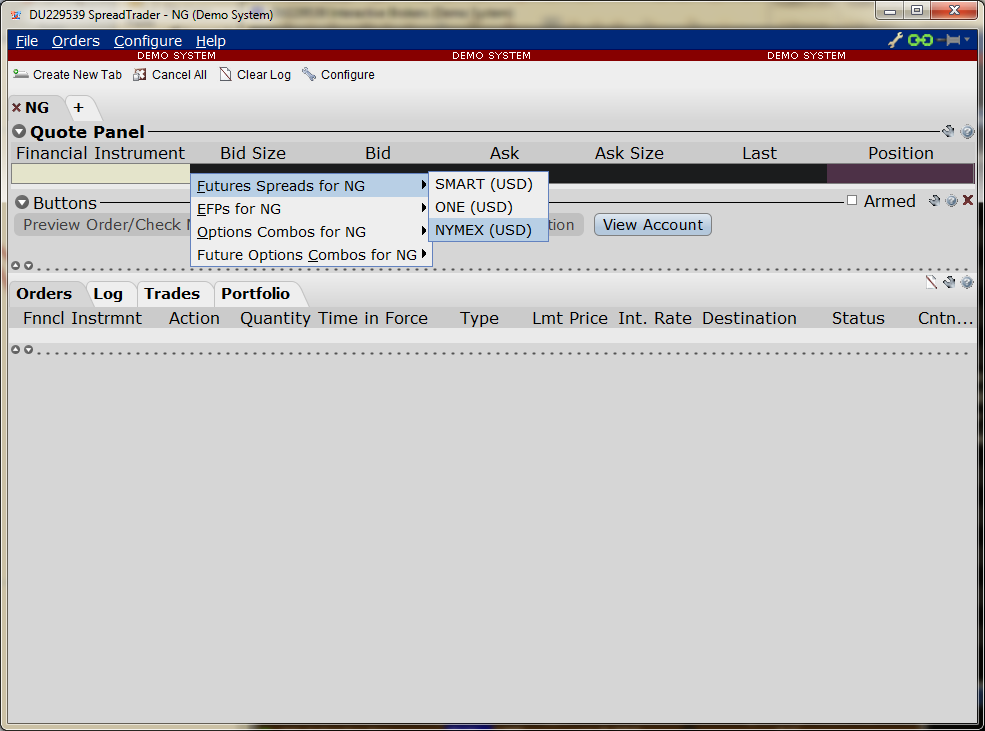
This is where to select the relevant menu item from the SpreadTrader utility:
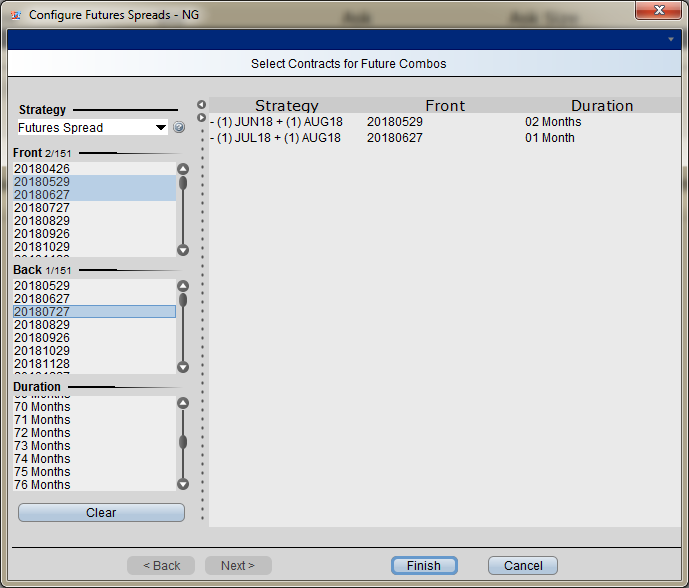
This is how to select the front month and back month. Importantly can not select just one calendar spread, must select two or more spreads otherwise the “Finish” button does not appear.
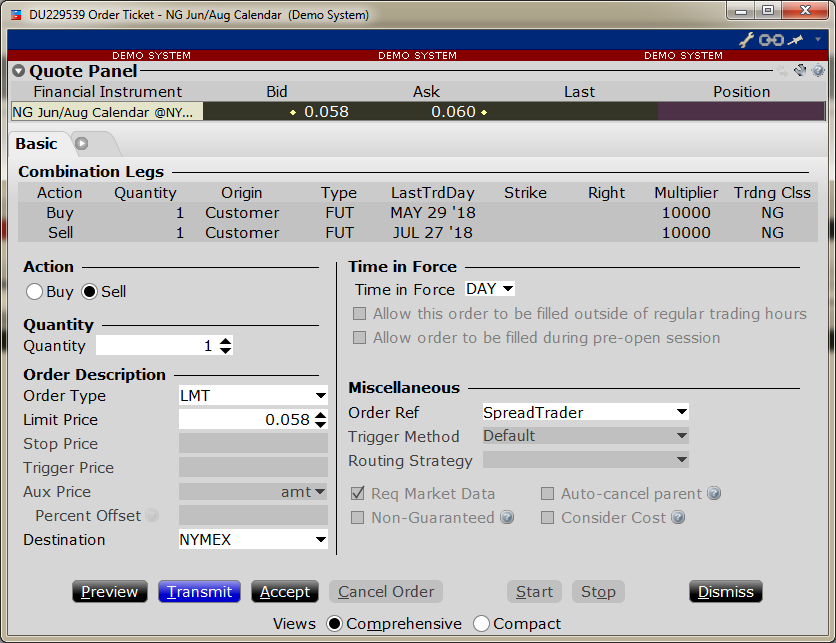
Click on the relevant “ask” for the calendar spread and the following order entry will appear.
As we are selling, make sure the limit price starts higher than current Ask.
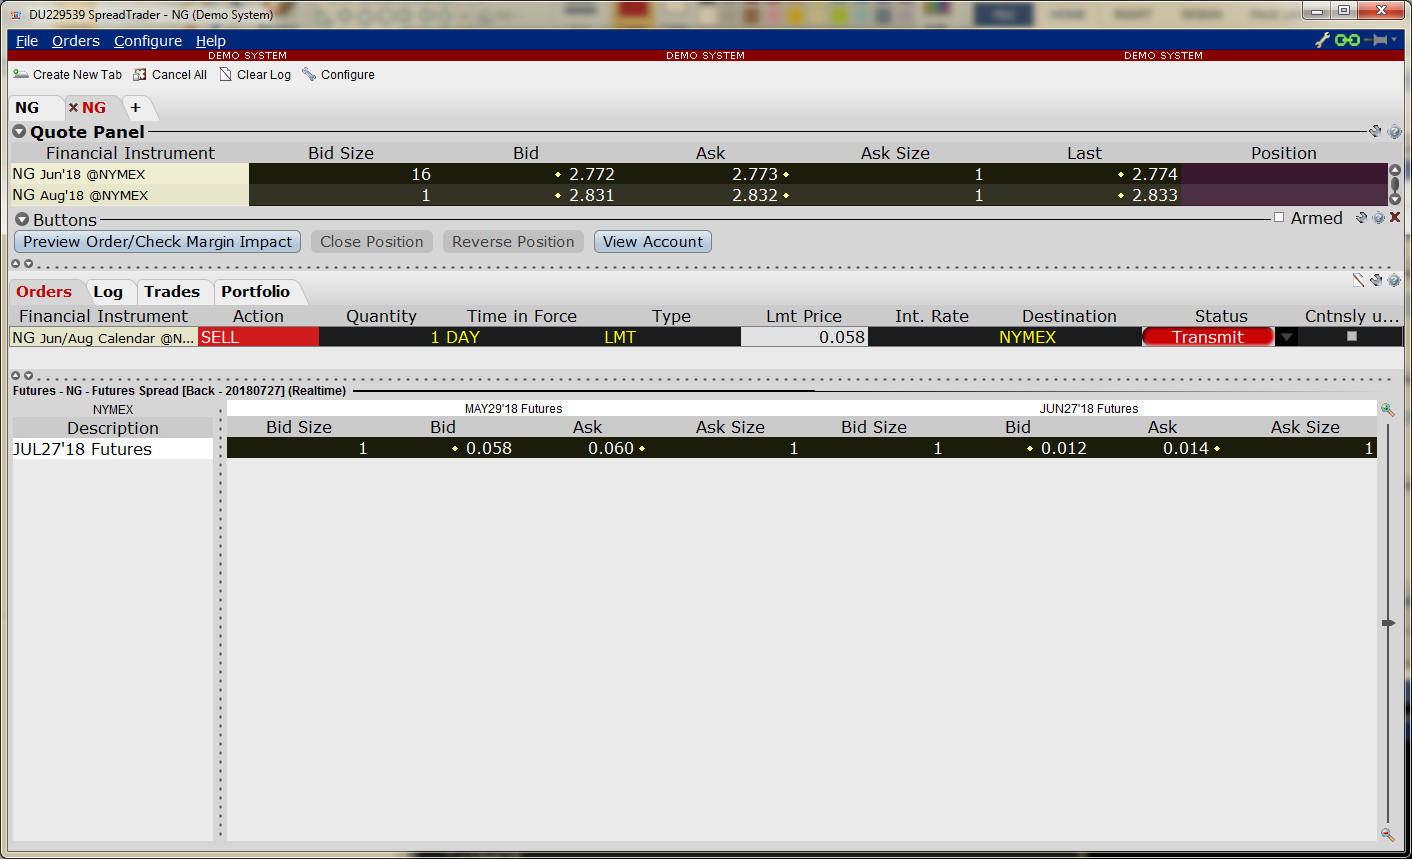
Followed by this order display:
Walk down the limit price downwards (because we are selling) by 0.001 increments on the order until you achieve a fill.
Trade Update
This trade update was on 18th April 2018 to enter a GTC order to allow possible trade exit after the time frame for the 30 day rule has elapsed.
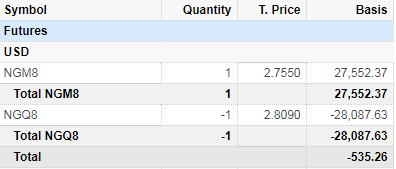
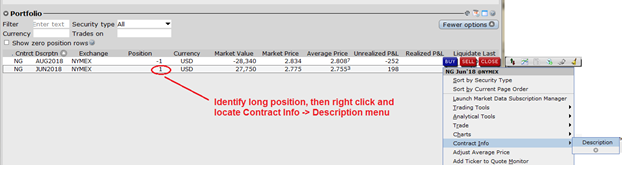
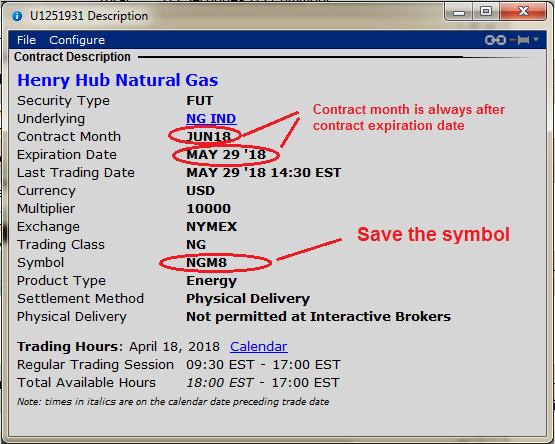
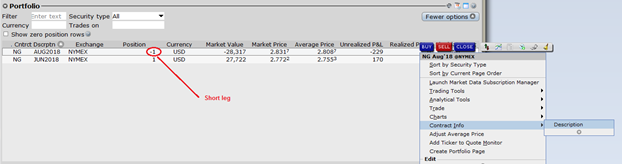
Identify the long future leg in the front month from the Account Positions, and select Contract Description menu:
Review the contract description and note the symbol. In this case the symbol is NGM8. Verify that the futures contract named month and actual expiration date are as expected.
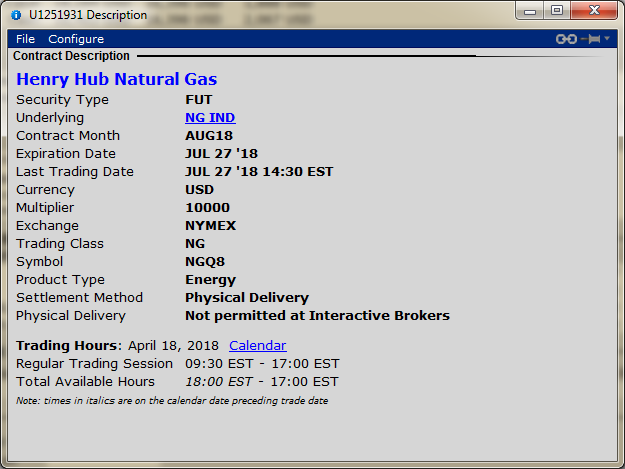
Repeat process for the short future leg in the back month from the Account Positions, and select Contract Description menu:
Review the contract description and note the symbol. In this case the symbol is NGQ8.
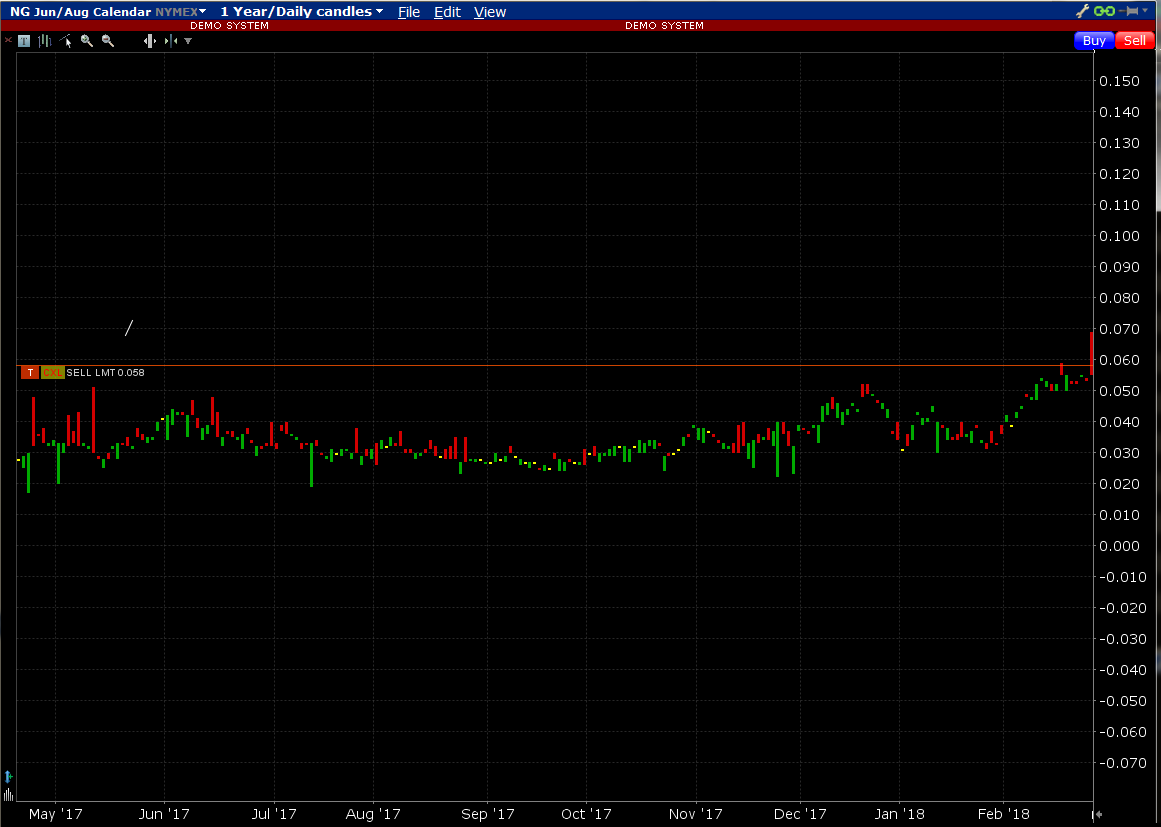
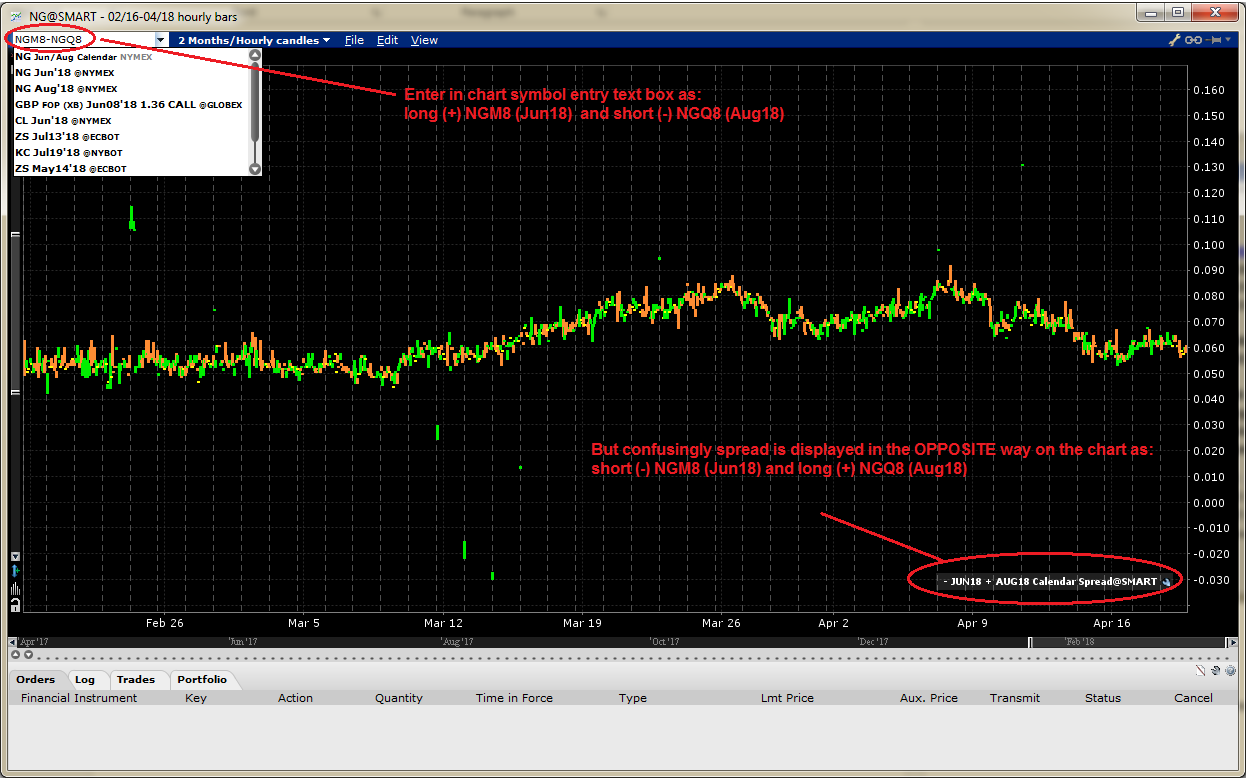
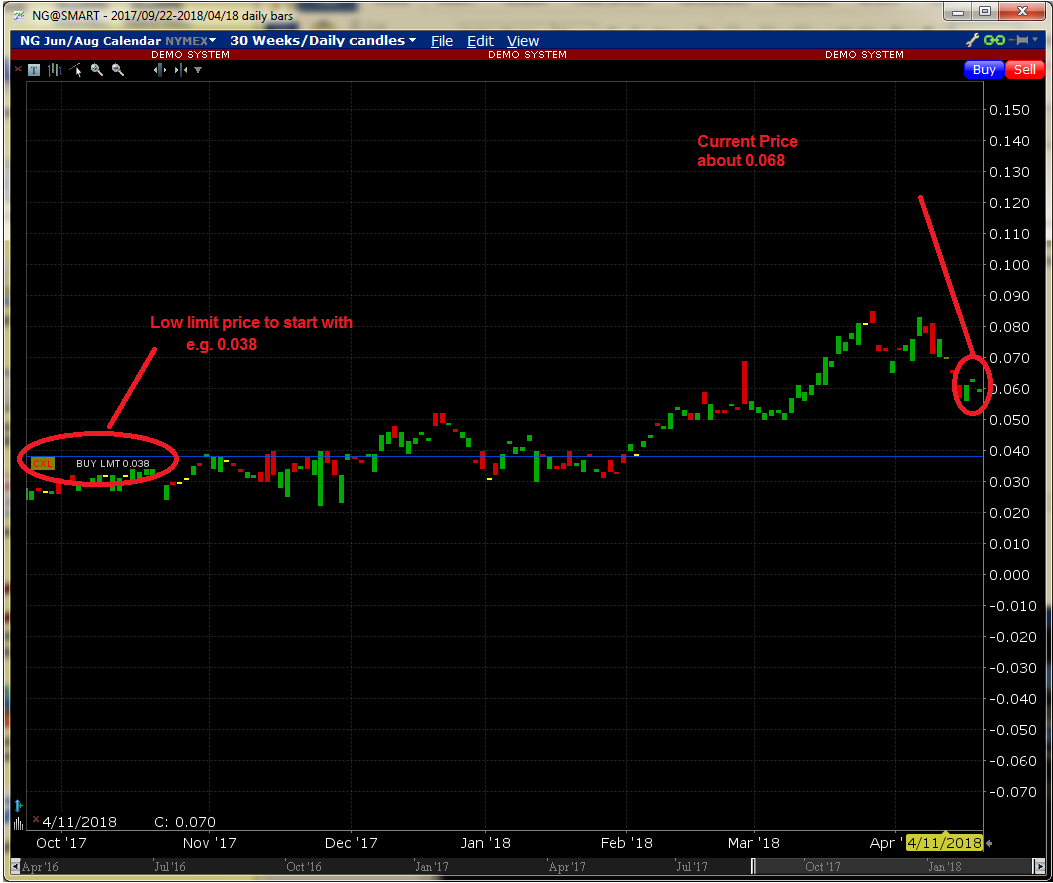
Now look at the chart to identify a target exit price. Create a new chart of the calendar futures spread that is the long near month contract minus the short back month contract
Cut and paste NGM8-NGQ8 into the chart symbol entry text box and press ENTER. In this example NGM8 Jun 18 is the near month and NGQ8 Aug 18 is the back month. Important – note that the label shown on the chart is the exact OPPOSITE way to what was entered!
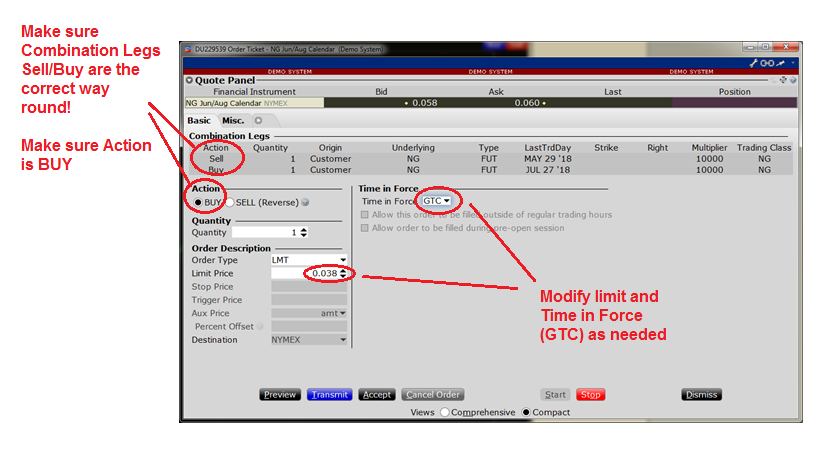
Now create limit order exit trade to Buy. Right click on the chart and select Buy and drag down the line significantly underneath the chart. Click the “T” on the order.
To exit this trade need to sell the near month (that is long Jun 18 position) and buy back the far month (that is short Aug 18 position). IB defines this exit trade as a Buy 1 Calendar Spread. Since we are buying, start limit order with a low limit price, so that it can be cancel and corrected (updated) multiple times to achieve a better price. In this example started at 0.038. See the screenshots below for an example order.
Order Entry:
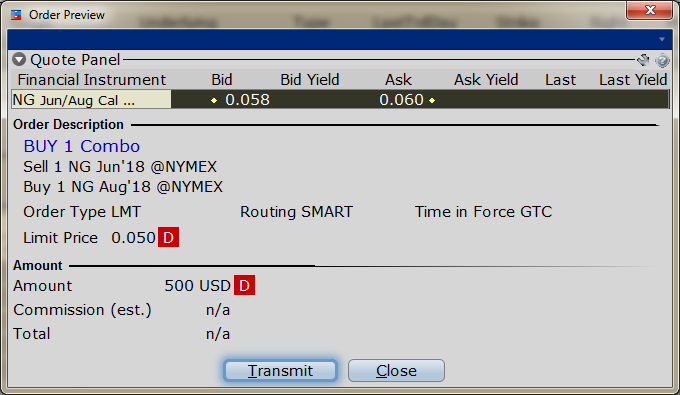
Order Preview:
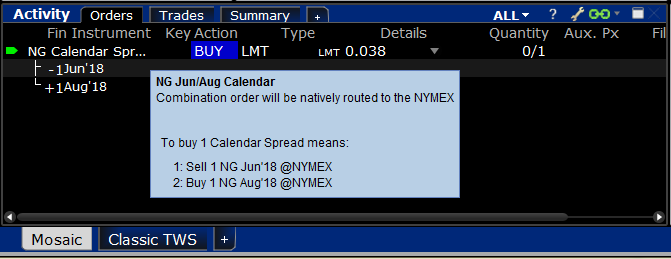
Active Orders:
Trade Summary
Looking at the chart, trying to achieve the lowest price makes sense, as we wish the difference between the near month Jun 18 and far month Aug 18 to shrink not expand. This can be a good til cancelled (GTC) order that can be hung out there until a price target is achieved – historically there seems to be support at 0.040 to 0.030 range, so that could be a good starting target (but you can obviously adjust for your trading style). If you want to get an immediate fill on a trade exit today, then just cancel and correct the order in 0.001 increments until it fills. Alternatively you can leave the order out there for the trading day to see if anyone nibbles at it, then get more aggressive on closing it nearer the end of the day.
In theory most futures calendar spreads are mean reverting, so we are looking for a move back towards the long term mean to capture some gain. We are not looking to make a killing on the directional trade – even though this is a “long” natural gas trade it usually a pretty slow moving spread. Additionally the spread may only go into that range for a few hours or days during its remaining trade lifecycle into end of May expiration, so we just want to grab a good price with a GTC if it’s there. Also we don’t want to hang around for the unpredictable spread volatility for the 2 weeks or so prior to expiration, so if it is still open at that time we’d probably just close when it gets too close to expiration.
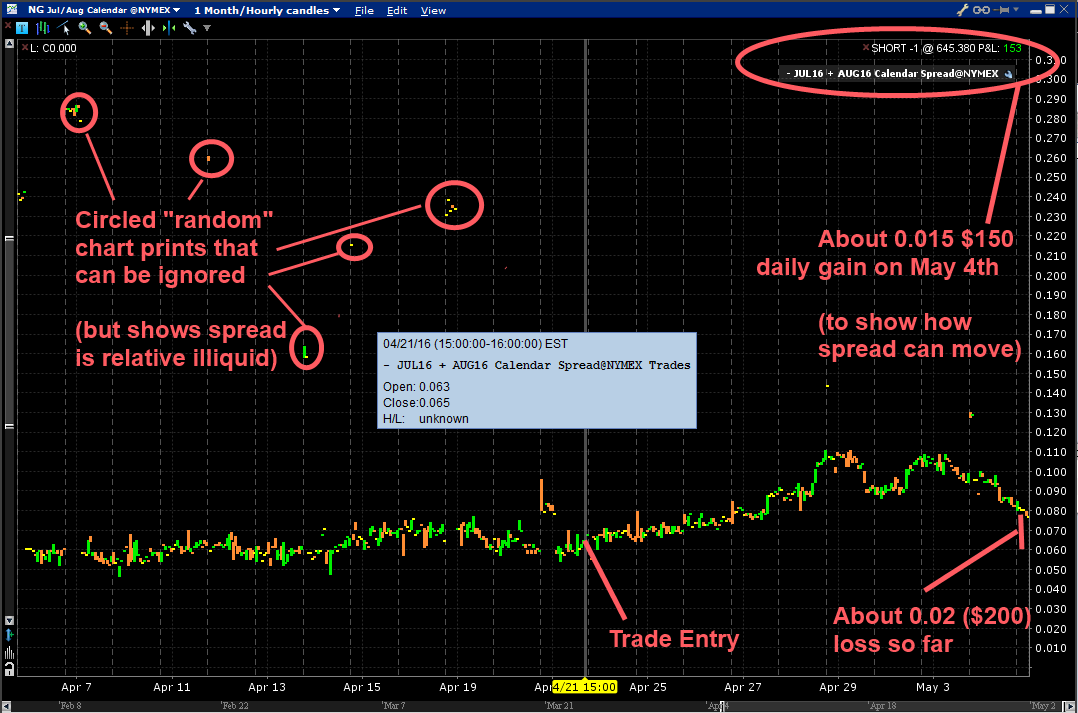
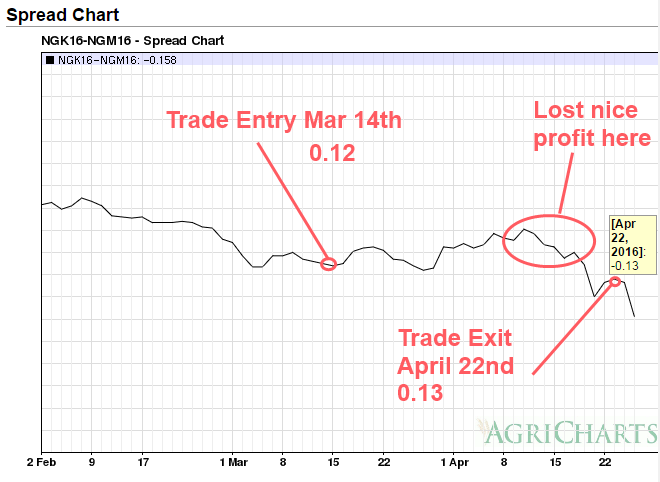
Trade entry was a Natural Gas /NG Bullish Short Futures Calendar entered on 22-Apr-2016. The following marked up chart shows the original trade entry on April 22nd with some historical context on the last months trading action:
Trade Opinion
The aim is to be bullish natural gas, with the assumption that the nearer term month future will go up faster than the far month future. The near month future has about 45 days to go to expiration, so has time for the 30 days to pass, so it can be liquidated under the 30 day rule (as a spread).
The circled “random” chart prints on the chart image can be ignored, because presumably they are not real trades – however this does show that the spread is relative illiquid. This means that should always use limit orders for trade entry and trade exit, to avoid potentially large slippage. Even on 1 contract trade, this could be as much as $100 (0.01) either way throughout a trading day (check the chart) – so it can be significant to overall strategy profitability.
The spread can also move around between $100 and $200 (0.01 and 0.02) per day, but that is still within a manageable range on 1 future contract trade. The trade is a relative value mean reverting trade, so in theory it is not that likely to move massively in opposite direction for a long period of time – it will theoretically tend to move back into long term averages – so big spikes up or down tend to mean revert over time. The risk is that the “in theory” part is understated and the spread will lose more money than comfortable for a single portfolio position. In our portfolio this is managed by trading small enough (1 contract) to stay in the trade without worrying too much about temporary adverse moves over a few days.
Need to stay another 2.5 weeks in this trade because of 30 day rule, but then can re-evaluate. If some mean reversion has occurred and the Natural Gas /NG price has risen, the spread could come back to profitability. It is currently in an expected range, so no need to adjust yet.
Trading futures options vertical spreads and futures calendar spreads can have their own nuances when the trade gets close to expiration. Here we look at some real life examples from our Natural Gas /NG trades in the past few months.
Future Options Vertical spreads
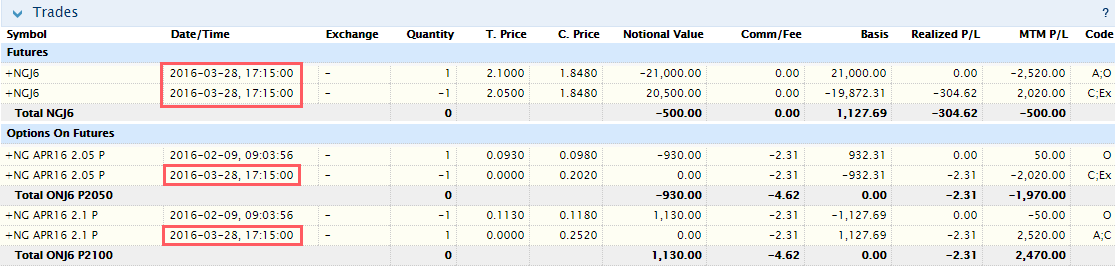
What happens when both legs of a natural gas spread trade expire in the money at expiration ? Unfortunately in our case here this was full loss on a bull put spread, however given that the natural gas /NG price moved about 14% against the position, we are grateful for the protection afforded by the spread to limit the loss.
Both legs of the bull put spread got assigned into their respective futures positions at the option strike price, then they immediately get liquidated because they cancel each other out. This is literally buying and selling the same futures contract at the same time at two different prices. This results in an instant profit or loss, depending on what the spread was. The following trades highlighted in red show this exact process. Note that the trade times are all identical, because this was instantly matched by the futures clearing system.
Although the future is assigned to the underlying commodity, these are options on futures that settle to the futures. Importantly the options expire a few days before their underlying future does. This gives you a few days so you don’t end up the proud owner of 10,000 million British thermal units (mmBtu) of Natural Gas!
If you own the underlying future on the future expiration date and it is NOT cash settled, then you could theoretically be made to deliver or receive the contract amount of the underlying commodity. In practice many brokers will monitor their clients positions and start contacting you if you have a commodity futures contract that requires physical settlement expiring in the next week. For example Interactive Brokers will email you 7 days before the futures contract expires to remind you of your responsibility. They additionally point out that they will liquidate the position on the final trading day if it looks like you are in danger of taking physical delivery.
Obviously for something like natural gas that is (probably) not desirable. However it is conceivable that someone might wish to talk delivery of precious metals, but most future brokers won’t let you.
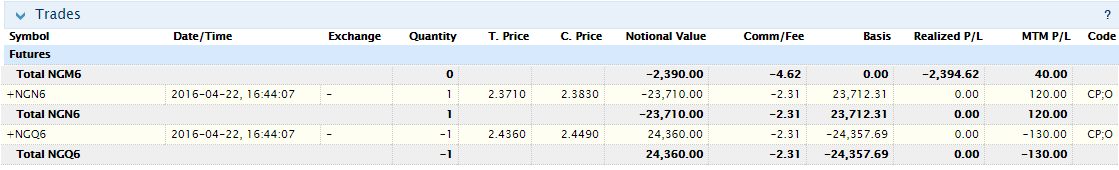
Futures Calendar Spreads
Futures Calendar spread are buying one futures contract in one month at the same underlying, then at the same selling the same underlying futures contract in a different month. Typically “buying” the calendar spread is short near month, long far month. “Selling” the calendar spread is buying the near month and selling the far month. Typically being long the near month implies a bullish position on the underlying price. Being short the near month implies a bearish position in the underlying. With a futures calendar spread you are looking for it to move in a particular direction. The actual credit or debit received isn’t at relevant as the value you can take it off for. You are literally playing the near month contract against the far month contract, as a relative trade. That is of you are bullish you are betting that the near term contract goes up faster than the far month contract. Obviously they will be correlated and almost definitely move in the same direction, but you are playing the rate of change in the spread between the two contracts – basically a very highly correlated pairs trade but that can still move enough to profit.
Traditionally this is seen as a less risky way to express direction on an underlying. For example a natural gas futures contract for the near month could have a range of $5k a month, but the spread would only move up to $1000. This is reflected in the margin for a calendar spread which can be only a few hundred dollars, so the return on capital can be very good, even if the risk is controlled.
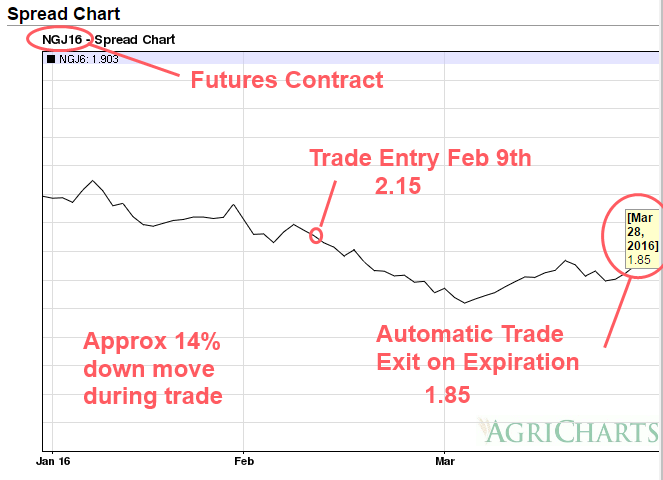
Also calendar spreads seem to see wilder less predictable swings into expiration. These do not always reflect the original trade result, even if the underlying moves as you actually expected. Usually a long near month, short far month futures calendar is typically bullish the underlying. For the example the following chart shows a recent /NG calendar, that was originally trading nicely with our original bullish intent up to about a week before expiration.
Then the spread suddenly reversed course, even though the underlying near and far month natural gas price went up. The differential between the near and far month changed from as expected in the early part of the month, to significantly inverse in the last few days. This actually ruined a profitable trade very quickly which was unfortunate. Moving from $360 profit to $110 loss (that could have been worse it went as low as $360 loss before we traded out of it). It is important to note again that the underlying price went up, which is what we were hoping for – yet the spread reacted opposite to what we expected. Lesson learned : take a spread profit when it is there, and don’t hang around too long into unpredictable expiration to squeeze out the last little bit of profit.
BTW – This chart was created after our trade has expired using this free historical future calendar online charting tool. This is really useful for checking historical performance quickly, especially to observe historical future calendar spread behaviour into expiration – so you know potentially what to expect in the future.
So what is the conclusion here?
The liquidity for futures contracts typically dries up a lot in the last few trading days of it’s life. This is typically because many traders have rolled their positions to the next futures month.
Combine that with the threat of broker liquidation at unfavorable prices, there is typically not much to recommend trading the final 5 days of a futures option or future contract.

 Although the $13 put Jan 2022 hedge was ultimately a money loser, it did enable the position to be hedged towards the end of the huge downdraft from $20 (Oct 2021) to $12 (Dec 2021). Ultimately enabling exiting with the overall UNG position with a profit in Jan 2022. Just because the hedge doesn’t make you money, doesn’t mean it is useless – the overall position of underlying, plus any hedges, is the main consideration.