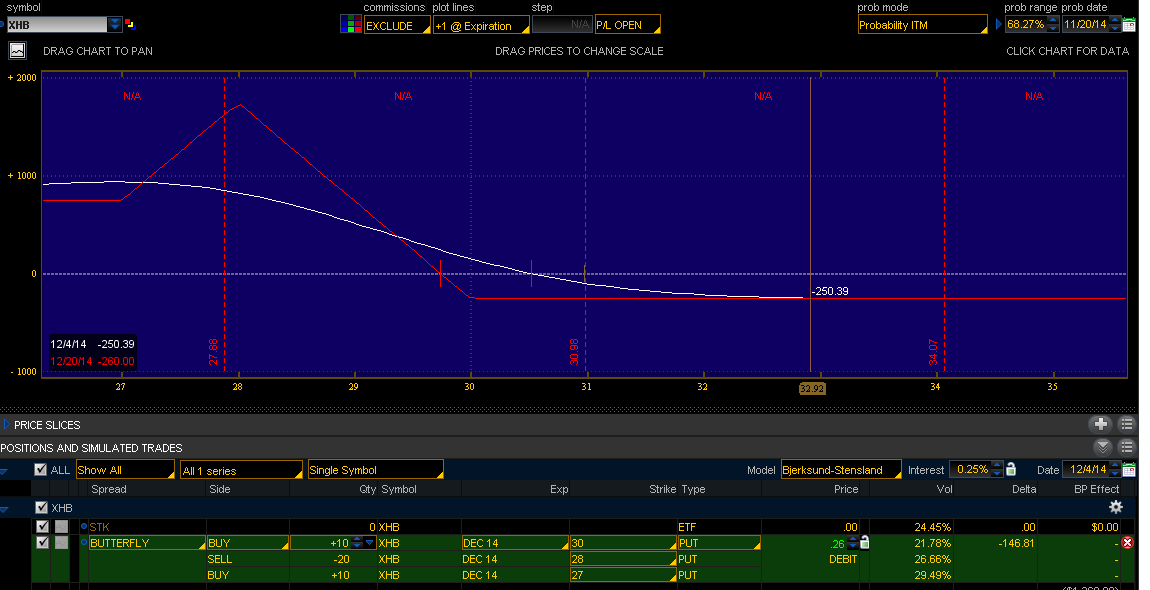
This trade idea is a trade adjustment to a currently open bearish trade on the Mexican Market ETF (EWW). The strategy ultimately converts the existing bearish diagonal spread into a bearish Put Butterfly.
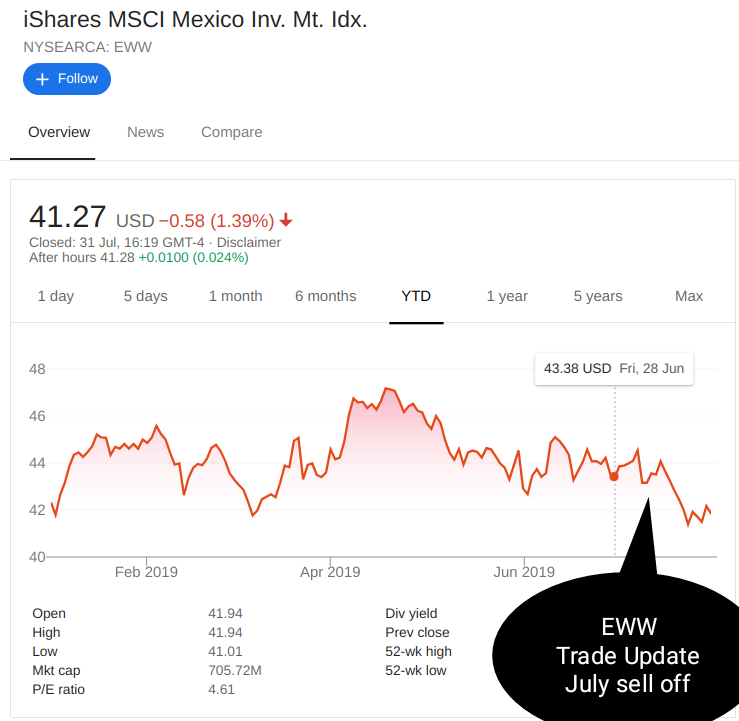
Trade Update for 30 July 2019
A trading update on July 30, 2019 shows that the ETF has brought the speaking been in a range for the majority of the month around the $42 mark. However with the federal reserve rate cut announcement there was a drop off on the afternoon of 30 July that has caused for the ETF to move down beneath the $42 strike in August. This means that the August short put is now ITM and needs to be managed accordingly however this is being fully offset by the $43 port in the September cycle. The aim here would be to maintain the position slightly closer to expiration to allow any time premium to drain out of the August cycle, and then either close the position or do a short put roll into September.
The rolling options are to either roll the $40 put into either a $41 or lower put to maintain the bearish position into Sept 2019. Alternatively the put could be rolled to create a September butterfly by selling twice as many puts and adding a down side put for protection. This would create a butterfly that can be held into September expiration. Ideally this would be done into a higher volatility environment to get as much juice as possible into the September options.
The position has approximately $120 profit and long as the etf stays under the $42 level this profit is not at risk. The 30 day calendar period has elapsed so the position can be closed or adjusted anytime. Therefore position can be maintained for a few extra trading days and monitored for a good Time to roll into September once even more time value has drained out of the August short put. Currently there is still approximately $0.50 time value (or about $300) left in the August short put, so this is a potential time profit that can still be extracted from the position.
Ultimately no adjustment was done today.
Trade Update for 1 August 2019
On 1st August 2019 in afternoon trading the Trump administration announced more tariffs against China. This somewhat spooked the markets triggering a fairly swift sell off in markets especially those effected by tariffs. This meant that the August short put at $42 has gone significantly ITM. With Mexican ETF EWW trading at approximately $40.75 the put had only about $0.20 extrinsic value, so it was a good candidate for rolling.
The sell off generated increased volatility in a short amount of time and ATM put premium in September looks quite attractive to roll into. This was an opportunistic trade due to the swift selloff, so the decision was taken to convert the position to buy September butterfly.
The August $42 put was brought back (buy to close) for a $450.71 loss, and was replaced with 12 contracts of $41 puts sold to open in September, followed by 6 contracts of $39 puts bought to open. The existing $43 put in September was maintained and not changed as part of the position. This converted the entire position into a $43/$41/$39 September butterfly. The entire new position result in a $288.67 credit, so the most that can be lost on the trade is now -$450.71 (from the losing $42 august option roll) plus the $288.67 credit received for Sept butterfly – so max position risk is now only $162.04. This roll was all completed in one trade ticket with one set of commissions.
This table gives the new position below. The top two options rows are option roll described above. The last option row is not a new position, but simply maintaining the original long $43 put from the original trade entry.
|
<![if IE]><![endif]> |
This roll exchanged approximately $0.20 of time value in the August cycle for approximately $2.00 time value remaining in the September cycle. If there is a large move either way over for example $43 or $39 then the maximum amount will likely be lost. The optimum trade scenario would be to close around $41 at September expiration. Because the trade is a butterfly trade it will benefit from a decrease in volatility and from the waiting until expiration. Given the low risk in this trade it would be fine to wait until very close to September expiration. Even if Mexican ETF EWW moves around a lot there will likely not a significant profit/loss changes until closer to expiration.
Summary of Mexican bearish put diagonal spread (converted to butterfly)
The Mexican ETF EWW will likely be volatile over the next week or two and may well move outside the ideally trading range of $39 to $43. But the approximate $41 target for September is on the low-end of the historical trading range for the last six months (a historical support line) so it is possible that becomes resistance with a move down in August and subsequent rally back up in September. However the trade will be held and re-evaluated in 30 calendar days - basically a low risk trade waiting for lower volatility and getting closer to September expiration.