Category Archives: Options

Brexit Trade Exit – 18-Apr-2016

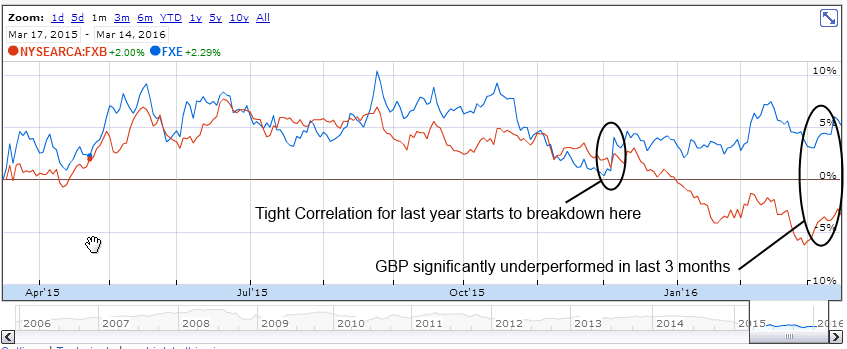
Last month Brexit Short Pound Long Euro Trade update we started a medium term trade betting that the pound will trade lower into June Brexit on fear of an exit poll. The trade was to short Great British Pounds (GBP) using 3 E-micro futures /M6B in Jun 2016 (symbol /M6BM6), and long Euro (EUR) using 2 E-micro futures /M6E in Jun 2016 (symbol /M6EM6). Each side had a notional value of approximately $26k USD. The 3:2 ratio is simply chosen so that the notional amounts are identical, because of the different contract size for each currency. Trade entry was 14th March 2016. We originally attempted to hold it as a position trade into the brexit referendum date in June 2016, but if our risk management rules take us out we will exit.

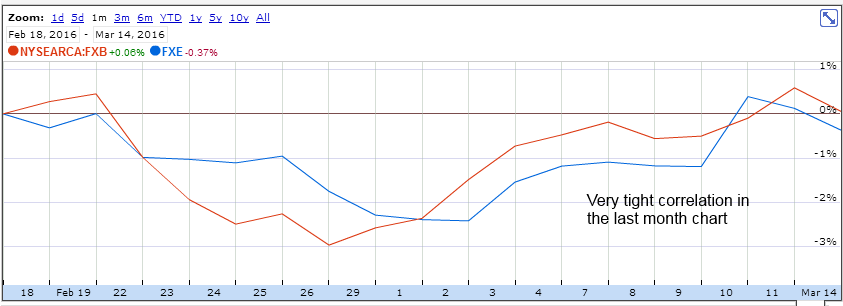
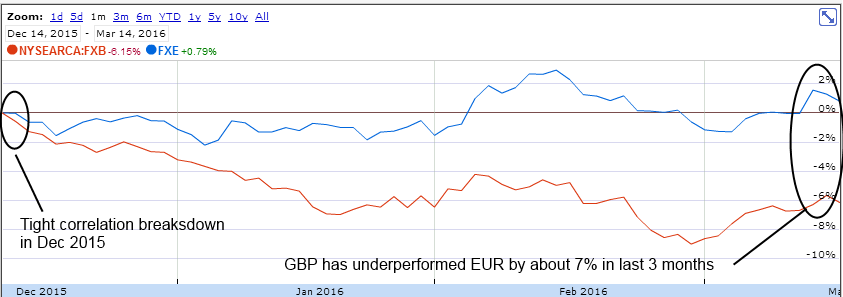
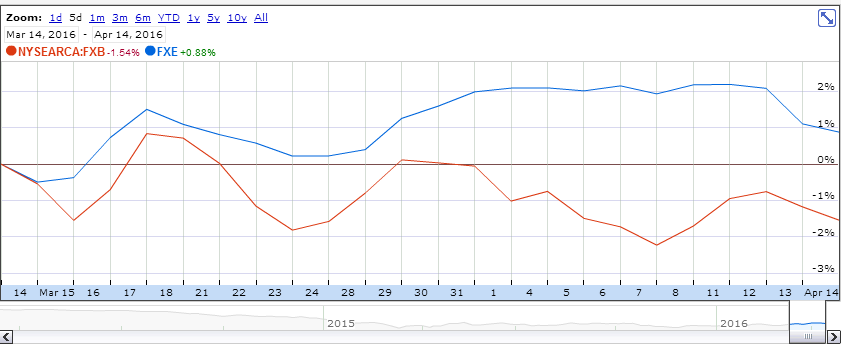
The Great British Pounds (GBP) future was the original short, and we sold Euro (EUR) against it to offset the risk somewhat. Because the Euro moves closely with the Pound over last year, this is a fairly closely correlated pairs trade. Pound is relatively flat for last month, and the euro had rallied a bit.
Recall from last month, we also had also completely hedged with opposite fx positions into the March 17th BOE meeting.

Profit Loss update at end week April 15th

Looking at the overall position on April 15th 2016 approximately 1 month later we have:
$250 profit on short 3 E-micro futures /M6B
$350 profit on long 2 E-micro futures /M6E
-$100 on long pound fx hedge
-$150 on short euro fx hedge

M6B Short April 2016 GBP Brexit Pair 20160415 - trade adjustment

Over this month the Pound has been down about 1% and Euro up about 1.5% (so not a huge amount of movement). However this price movement has given some options to make position adjustments.

M6B Short April 2016 GBP Brexit Pair 20160415 - 1 month correlation

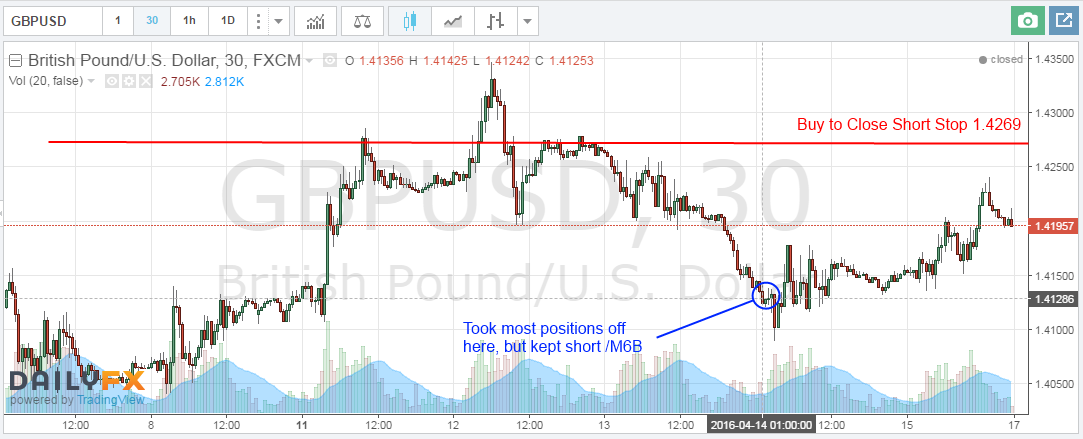
We exited all positions, except the Pound future, for a total profit of $100. Then immediately added a stop to buy back the short pound at 1.4269 (entry was 1.4282). This stop was chosen only to allow for about 0.0013 slippage on the micro future and still guarantee a small profit of about $20 on the short future position. This would give us a total minimum profit of about $120 ($100 + $20) on the entire position, and still gives approximately a 1% wiggle room to the stop. However it is still possible (and potentially likely) to get stopped out, but crucially we can still maintain the short pound position with no risk from the overall trade. If we get stopped out, will likely be able to establish at better levels. If GBPUSD continues to go down, then will have established a decent sized position for no risk – if that happens, then likely would exit before the Brexit decision in next few weeks.

Final (enforced) Exit on Mon Apr 18th

Update: as of Monday, got stopped out this morning at 1.4270 so no longer have any position. Note the 0.0001 slippage from the actual 1.4269 stop. Cannot rely on stops to exit exactly at specified price, so always allow for some slippage between the stop and your required exit price. The slippage is typically dependent on product liquidity and when the stop executes. These FX Micro futures on /M6B are typically liquid with 0.0001 spreads during the day, but appear to move to 0.0002 in overnight US trading. You may get better executions during US hours. For example our execution was with only 0.001 slippage at 10.56am.

Total P&L was $120 – we had locked in a gain originally of $350, but that last adjustment from Friday cost us about $230 in giving back profits. However even though it got stopped out today, we did manage the risk well and ultimately turned the position into a “zero risk” trade.

Trade exit final review on Fri Apr 29th

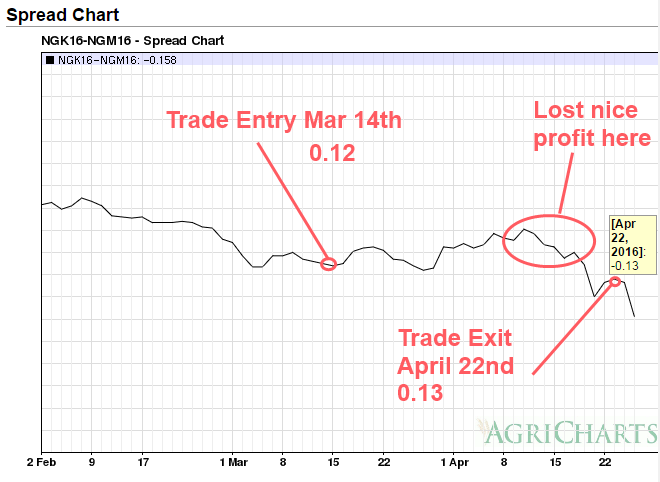
Reviewing this trade again after the exit 2 weeks ago, shows that the in short term the trade theory was invalidated. The following chart shows how the trade would have moved significantly against it, if we had stayed in it.
M6B Short April 2016 GBP Brexit Pair 20160430 - trade exit review

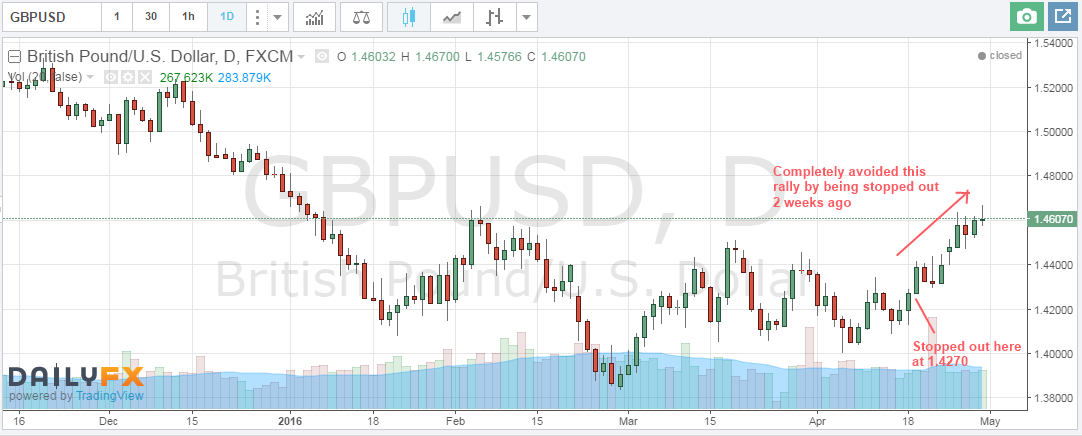
However we did make a small profit – we might look a retrying this trade soon as these high levels. The importance of our risk management is that we are not emotional scarred from being wrong, so we can evaluate any new trade on its merits, not trying to get back to break even.

Futures Options and Calendars near expiration

Trading futures options vertical spreads and futures calendar spreads can have their own nuances when the trade gets close to expiration. Here we look at some real life examples from our Natural Gas /NG trades in the past few months.

Future Options Vertical spreads

What happens when both legs of a natural gas spread trade expire in the money at expiration ? Unfortunately in our case here this was full loss on a bull put spread, however given that the natural gas /NG price moved about 14% against the position, we are grateful for the protection afforded by the spread to limit the loss.

NG Mar 2016 Bull Put Spread 20160328 Trade Exit Chart

Both legs of the bull put spread got assigned into their respective futures positions at the option strike price, then they immediately get liquidated because they cancel each other out. This is literally buying and selling the same futures contract at the same time at two different prices. This results in an instant profit or loss, depending on what the spread was. The following trades highlighted in red show this exact process. Note that the trade times are all identical, because this was instantly matched by the futures clearing system.

NG Mar 2016 Bull Put Spread 20160328 Trade Exit

Although the future is assigned to the underlying commodity, these are options on futures that settle to the futures. Importantly the options expire a few days before their underlying future does. This gives you a few days so you don’t end up the proud owner of 10,000 million British thermal units (mmBtu) of Natural Gas!

Fear of Futures Settlement

There are several important dates: option expiration date and futures expiration date. On option expiration if your option is in the money, will be assigned into the futures contract.

If you own the underlying future on the future expiration date and it is NOT cash settled, then you could theoretically be made to deliver or receive the contract amount of the underlying commodity. In practice many brokers will monitor their clients positions and start contacting you if you have a commodity futures contract that requires physical settlement expiring in the next week. For example Interactive Brokers will email you 7 days before the futures contract expires to remind you of your responsibility. They additionally point out that they will liquidate the position on the final trading day if it looks like you are in danger of taking physical delivery.

Obviously for something like natural gas that is (probably) not desirable. However it is conceivable that someone might wish to talk delivery of precious metals, but most future brokers won’t let you.

Futures Calendar Spreads

Futures Calendar spread are buying one futures contract in one month at the same underlying, then at the same selling the same underlying futures contract in a different month. Typically “buying” the calendar spread is short near month, long far month. “Selling” the calendar spread is buying the near month and selling the far month. Typically being long the near month implies a bullish position on the underlying price. Being short the near month implies a bearish position in the underlying. With a futures calendar spread you are looking for it to move in a particular direction. The actual credit or debit received isn’t at relevant as the value you can take it off for. You are literally playing the near month contract against the far month contract, as a relative trade. That is of you are bullish you are betting that the near term contract goes up faster than the far month contract. Obviously they will be correlated and almost definitely move in the same direction, but you are playing the rate of change in the spread between the two contracts – basically a very highly correlated pairs trade but that can still move enough to profit.
Traditionally this is seen as a less risky way to express direction on an underlying. For example a natural gas futures contract for the near month could have a range of $5k a month, but the spread would only move up to $1000. This is reflected in the margin for a calendar spread which can be only a few hundred dollars, so the return on capital can be very good, even if the risk is controlled.

Also calendar spreads seem to see wilder less predictable swings into expiration. These do not always reflect the original trade result, even if the underlying moves as you actually expected. Usually a long near month, short far month futures calendar is typically bullish the underlying. For the example the following chart shows a recent /NG calendar, that was originally trading nicely with our original bullish intent up to about a week before expiration.

NG Mar 2016 Short Futures Calendar NGK6 - NGN6 20160422 Trade Exit

Then the spread suddenly reversed course, even though the underlying near and far month natural gas price went up. The differential between the near and far month changed from as expected in the early part of the month, to significantly inverse in the last few days. This actually ruined a profitable trade very quickly which was unfortunate. Moving from $360 profit to $110 loss (that could have been worse it went as low as $360 loss before we traded out of it). It is important to note again that the underlying price went up, which is what we were hoping for – yet the spread reacted opposite to what we expected. Lesson learned : take a spread profit when it is there, and don’t hang around too long into unpredictable expiration to squeeze out the last little bit of profit.

BTW – This chart was created after our trade has expired using this free historical future calendar online charting tool. This is really useful for checking historical performance quickly, especially to observe historical future calendar spread behaviour into expiration – so you know potentially what to expect in the future.

So what is the conclusion here?

The liquidity for futures contracts typically dries up a lot in the last few trading days of it’s life. This is typically because many traders have rolled their positions to the next futures month.

Combine that with the threat of broker liquidation at unfavorable prices, there is typically not much to recommend trading the final 5 days of a futures option or future contract.

Brexit Trade Entry – 14-Mar-2016

This post describes a medium term trade betting that the pound will trade lower on uncertainty into the June 23rd UK referendum on whether to exit the European Union (EU) – dubbed Brexit by the media.

The trade is to short Great British Pounds (GBP) using 3 Micro GBP /M6B futures in Jun 2016 (symbol /M6BM6), and long Euro (EUR) using 2 Micro EUR /M6E futures in Jun 2016 (symbol /M6EM6).

Each side has a notional value of approximately $26k USD. The 3:2 ratio is simply chosen so that the notional amounts are identical, because of the different contract sizes for each currency. Trade entry was 14th March. This idea was from an FX Crosses trade idea from tastytrade.com, but one that we think we can use within our 30 day Rule restrictions. Typically this would be a scalping trade for few hundred dollars over a day or so, but we will attempt to position trade for a month or more.

For the record personally don’t think that United Kingdom (UK) would vote for an European Union (EU) exit, but with numerous exit polls and political statements along the way there will be a lot of uncertainty into the final results announcement on Jun 2016. However we don’t think we have a crystal ball so our personal opinion is not really relevant, therefore trade will be exited early and not wait for final result. This is trade is focused on the expectation of uncertainty into the result not the final result itself. This is a trade to “buy the Rumour, sell the news” trade or more accurately – because part of trade involves shorting pounds – it should be “sell the Rumour, buy back before the news”.

GBP EUR Correlation

The GBP EUR pair has a very tight correlation of about 0.71 in the last year. So what does that mean for our trade ? To recap correlation values typically vary between -1.0 (negative) and 1.0 (positive). A highly positive correlation means that the two products will typically move in the same direction mostly of the time (S&P 500 ETF (SPY) and Nasdaq (QQQ) would be a good example). A highly negative correlation means that the two products typically move in the opposite direction most of the time (S&P 500 ETF (SPY) and Volatility (VXX) would be a good example. Typically you would be looking for pair trades that were either below -0.5 or above 0.5 – because anything in between that range does not give enough of a correlation pattern (it could just be considered noise).

For the following we are using the relative charts of the ETFs FXB (Pound) & FXE (Euro) to show daily moves over a monthly time frame. For our high level correlation analysis, these E-micro futures move almost identically to these ETFs, so they can be considered equal for this analysis.

The GBP EUR pair has a very tight correlation for the 9 months of the last year, but there has been a recent 3 month divergence since Dec 2015:
Brexit - 6B Mar 2016 Pound Euro Pair 20160314 - 1 year correlation

For reference in the last month has extremely tightly correlated:
Brexit - 6B Mar 2016 Pound Euro Pair 20160314 - 1 month correlation

However looking at a zoomed in chart of the last 3 months it is easy to see that GBP has underperformed EUR by about 7%:
Brexit - 6B Mar 2016 Pound Euro Pair 20160314 - 3 month correlation

FED meeting – March 16th

Apart from general market risk, the FX market experiences higher implied volatility and rapid directional moves around central bank announcements. The FED announcement on March 16th and BOE announcement on March 17th will affect this trade.

This trade was not made delta neutral into FED meeting on March 16th. This is because the direction of euro and pound will likely be the same, even if the actual direction is unknown before hand. This trade does not make money guessing direction correctly, it makes money assuming the Pound under performs the Euro in the next month or so. Typically the euro and pound will trade in the same direction, but because we are long/short as a pair in the same amount the direction risk is minimized. It is possible, but not very likely, that the Euro and Pound trade in opposite directions after the FED announcement.

BOE meeting – March 17th

However this trade was made delta neutral before the BOE meeting on March 17th. This was because this is event directly specific to one of the currencies in the trade pair. Remember the aim of the trade is to express the view that the Pound will be weaker than the Euro over the lifetime of the trade into a potential Brexit – however trading central back announcements is just a trade outcome that cant be easily predicted and FX rates react in a very binary way (up or down very quickly). Since this event has the potential to move the GBP side of pair significantly, this introduces unnecessary event risk into our pair, so we will neutralise the trade for the event, and then re-evaluate afterwards.

The trade was totally hedged the night before the event, by purchasing about $26k GBP/USD spot FX and selling about $26k EUR/USD (the exact opposite of our futures position). We cannot exit any trade legs immediately due to the 30 day rule.

At luck would have it, after the BOE meeting at 8am EST on March 17th, GBP moved rapidly higher (i.e. against our original position). By 4pm Thursday compared to 24 hours earlier before the BOE announcement (but after the FED announcement) GBP was 1.53% higher and EUR was 0.76% higher. If we had remained unhedged in the original futures only position into the BOE announcement, this would have lost approximately 0.77% of our trade, or would have lost about $200 of our unrealized $350 profit. However since the trade was now totally delta neutral so our unrealized $350 profit remained, because the spot FX positions exactly offset any movement in the micro futures (as expected).

Brexit Trade Exit – March 17th

Since we have a locked in guaranteed $350 gain, we may just hold the entire structure for a month due 30 day rule then exit with a gain. In future we would also probably just use GBP/USD or EUR/USD spot FX (standard FX trades) versus the Micro GBP /M6B and Micro EUR /M6E futures. Given that the BOE meeting was bullish for GBP we can simply hold this trade with no modifications. However in 30 days time we can reestablish this trade (if we still want to trade the potential Brexit) simply by trading out of the spot FX positions. Alternatively we can just exit all the legs simultaneously and take the profit.

Option Assignment on Option Expiration

What happens when you get an option assignment exactly at the option expiration date on a short call vertical spread? If you don’t exit a short call vertical spread at option expiration and it closed the middle of the strikes, then you will get assigned on the short call creating a short position the next Monday.

Accidental Option Assignment

This position was accidentally created on Feb 19th trying to exit a FXE short call vertical spread 107/109 spread, that ultimately closed in between the two strikes. FXE is the ETF that tracks the euro to USD exchange rate. It replicates the EUR USD exchange rate with decent liquidity of about 750,000 shares a day for the ETF and options that trade with penny wide option pricing.

To make it slightly more complicated this trade was in an IRA account, and brokerages do not allow short positions in retirement accounts. Important: You should contact your broker before market open if you got assigned like this in a retirement account like an IRA. This is because your brokerage might take matters into their own hands, i.e. liquidate the short position for you without asking, potentially with a market or in the illiquid pre market with poor pricing (they are within their rights to do this because you are temporarily at least breaking the rules). In extreme cases the broker might also liquidate other positions if your cash balance is very low. You generally must try and buy to close out the short shares as early as possible in the morning session (preferably in the first few minutes of the session). Therefore it would be advisable to contact your broker on the phone before market open to explain the situation. This is because you are not allowed to have a short position in an IRA – if you show willing with your broker that you did your best to try and get out of it that will help your position. Technically it might be possible to hold until the end of day, but as soon as you have a closed overnight position it would should up as a short position at end of day settlement.

How did we get into this mess?

Original intention was to exit a FXE call vertical spread 107/109 call spread on the last 15mins of trading day on Friday. In the last hour on trading on Friday from 3pm to 4pm FXE price ranged from only 108.83 to 108.88, so fair value for the spread never ever more than 1.88 and got as low as 1.83. Placed limit orders to exit at a mid price of 1.85, 1.90, 1.95 up to even 2.0, but never got filled in the last 5mins of trading. That means no one wanted to take the other side of the spread when expiration was only minutes away, even at $0.10 over fair value. It never actually occurred to us that would not be able to get a fill at any price (!). At 4pm market closed with no fill and obviously day limit order for our trade exit was cancelled automatically on market close.

FXE Feb 2016 short call spread accidental assignment - 20160222

Therefore we were forced to hold a net short position of $21,400 over the weekend, assigned on 2 options contracts at $107 (2 x 107 x100 = $21,400). Being short a currency over the weekend is typically not as risky as the stock market, because currencies tend not to move as quickly as equity markets and FXE has been fairly range bound in the last month from approximately $106 to $111. So was not so worried about the open market risk, more the actual exit execution with Fidelity (which actually turned out ok, with the caveats given below).

Trade Exit

FXE only trades US market hours like a standard ETF, where as obviously the currency trades 24 hours x 5 days including overnight. So if you can not get a pre market quote on a currency ETF like FXE, you use a currency trading website like dailyfx.com to track the actual euro price and work out almost exactly where FXE price should open on 9.30am on Monday. The currency chart price does not exactly match FXE price, but you can work this out as follows. Take the closing price on 4pm Friday close from the currency exchange rate chart (1.113) and current price now (1.101 on Monday about 9.30am ish), and work out the percentage change (1.101 – 1.113)/1.113 = about -1.08%. Then taking the FXE closing price from Friday (108.88) apply that percentage change by to give an approximate open value for FXE of about $107.70. We were fine exiting at that price since it was about break even for the original spread position, especially because the option spread was almost a full loser on Friday. For record the actual executed FXE trade price was $107.75 (including commissions).

FXE Feb 2016 short call spread accidental assignment - current chart - 20160222

Since on Monday Euro was down 1% in the morning on the NY open with a mini crash in progress on news of Brexit, we just covered with a market order. Normally we would use limit orders not market orders for exiting stock positions. However our broker (Fidelity) not being able to process a limit order without ringing up every time to cancel and correct it, and then they have to read the entire order back to you over the phone (due to option trading regulations). Cancelling and correcting say 10 times over the phone to get try and get a better fill over the phone is somewhat tedious and would have taken about 30 mins and given the market was moving quickly just decided to take advantage of the move lower on the open. Incidentally Fidelity fee for ETF trading directly with a trader on the phone is $32 (!) – fortunately they waived it as this was a “special case”. You cant be short stock in an IRA, so it was important to close out the position on Monday. Not sure what would happen if position was held onto for a few days, but its probably not a good situation for your account (Fidelity rep on the phone said Fidelity compliance would call, and enforce liquidation of the position or request significantly more cash to back up the short position).

In this case the situation turned out nicely, but generally this is not a good idea – so moral of the story always check your DTE and exit spread with a lot more than 1 hour remaining to expiration! In fact better yet roll 2 or 3 days before – its just not worth the hassle factor of exiting the capital intensive short/long positions on the Monday and the associated market risk. Basically waiting that close to expiration exposes potentially exit issues such as:
– significant gamma risk (losing a lot if the market moves quickly against you)
– inability to exit position at a decent price if you wait until last trading hour into option expiration
– needing to manage the resulting short position the following week

Conclusion

So in summary, a short position can be created in an IRA if an option assignment on a ITM short call spread occurs at option expiration. However if that does happen, it is definitely not a good idea to hold it more than one trading day because it violates IRA brokerage rules. It also may vary with how your broker would handle that in an IRA. For example Fidelity allowed trading out of it, but had to call in to manage that – however other brokers might have issues with that situation. In conclusion it is generally best to avoid getting into this situation in the first place, by not waiting until the last minute to exit and actively monitoring all your positions in option expiration week. Fortunately having done it once, you are not likely to do it again in hurry!

Expected Returns for your Trading System

We look at the expected returns for a simple trading system of a limited risk/reward option strategy, and figure out its expected return. Then we figure out how we can improve it given our 30 Day Rule constraints.

This material is based on some external research from TastyTrade, so don’t want to take credit for it – we are just adapting it for our 30 Day Rule. If you are interested on the research source behind this post, we would recommend looking their Mechanics of Risk Reward video. The rest of TastyTrade is worth looking at too, because they have tons of FREE options and futures education that you have to pay for everywhere else. Plus they are generally quite entertaining to listen to 🙂

What is the strategy?

The trade we will create a strategy from is the Iron Condor 2 or 3 point wide, sold with 45 days to expiration (DTE). This is limited risk risk/reward strategy, that is risk $2 to make $1. You can also adapt this approach for other trades as well, not just an Iron Condor.
For this discussion you don’t really need to understand exactly HOW the Iron Condor works – just that will be assuming that we place a trade that has the following expected outcome if you hold it all the way to expiration:

Trade ScenarioMax Profit / LossProbability of Profit/LossExecuted results on 100 trades
Max Loss on Trade-$26640%-$10,640
Max Gain on Trade$13360%$7,980
BAD RESULT! ----->-$2,660

So given that this appears to be a losing system – why bother to trade it?

Well, the above table has the following built in assumptions:
1 We hold everything to expiration and don’t do anything at all
2 The trade loss is ALWAYS the max loss – in practice that is not true.

Fortunately we can modify the assumptions
1 We do not need to hold to expiration
2 We can take winners early – if during the trade lifetime a profit target is reached then the trade can be exited.
3 We let the losers go and do not try to exit – but we can assume that not all of the losers will be max loss

So what does that look like ?
It turns out that with Iron Condors (and many other trades) that although a trade might ULTIMATELY end up being a loser AT EXPIRATION, and at some point in its trade lifetime you have the chance to exit with a winner.

Mechanics of Risk Reward video showed that the optimal time to exit is at 50% of max profit, and if you do that you have an 88% chance of exiting with a winner. Which is much better than the original 60% that the expiration probabilties would imply. To repeat the same thing differently, because its important – you have an 88% chance exiting with a 50% of max profit.

The above is based on being able to exit an anytime during the trade – but we have to work with the 30 day rule. So we would need to estimate the chances of exiting with a 50% after holding for 30 days inclusive. You can see the values we selected on the spreadsheet below (screenshot below) which allows us to model the concepts relatively easily:
Trading Strategy Analysis - Iron Condor - 20160204

Assumptions

The more times the strategy is run, the results should converge towards a much more predictable outcome – therefore theoritically the more you trade, the more likely you are to get the expected results.

Exiting winners with required trade exit profit % (e.g. 50% ) can be automated with Good Til Cancelled (GTC) orders (importantly after the 30 day holding period has passed).

Wait ? What ever happened to “Cut your losers and let your winners run”. Generally good advice for stock trading, but this is limited risk/reward system – and we know the risk on order entry (so one trade cannot take us out of the game).

Conclusion

This was to try and improve the results of our existing Iron Condor in our IRA accounts. So far in 2016 markets are cooperating with high implied volatility, which is great for Iron Condor strategies you can get more credit on trade entry. We are still working on verifying the above system but plan to refine it and actively use it with more capital in 2016.

Trading Small with Futures Options

Futures are very large principal products and the underlying value of a single futures contract can be anywhere from $23,000 for natural gas /NG and up to $160,000 for US Treasuries /ZB. This means that for many accounts trading them is prohibitively expensive. However fortunately there are options on these underlying futures, that provide a good amount of leverage. Using futures options it is possible to create trades that only risk a hundred dollars or less to make a few hundred dollars or more. These can have a risk reward of for example 1 to 3 (risk $100 with max profit of $300). This means that you can easily construct trades to work within a portfolio of smaller size for example $50,000. using futures options also allows you to benefit from time decay and also high implied volatility on the underlying (similar to standard equity options). this gives you a lot more flexibility than just trading the futures out right long or short.
Continue reading

OIH – Trade Entry – 19-Dec-2014

OIH150123P34PUT (OIH) MARKET VECTORS ETF JAN 23 15 $34 (100 SHS) Long 5 contracts $0.62/Share $308.92
OIH150123P35.5PUT (OIH) MARKET VECTORS ETF JAN 23 15 $35.5 (100 SHS) short -5 contracts $0.95/Share $473.11

Total income: $165
Total risk: $575
Risk reward: Approx 3.5 to 1

Trade was a little rushed into due to work commitments and only got it on at the close on Dec 19th.

The right direction, but poor execution in a weekly context (better execution available almost anytime this week). However IV is high enough and it is 40% OTM and direction in Oil should be “up” into the new year. Probably will be ok, but may give some stress next week.


VLCCF – Trade Entry – 19-Dec-2014

VLCCF has sold off massively into year end, mainly due to oil price. All small cap shipping stocks have been destroyed. Fortunately we sold 200 shares for about $14 earlier this year, so we have about $1000 profit to play with. So in Nov 2014 started selling puts against the position, with a view to getting either extra income or being assigned. Vol was high, so was a good play, however was still “early”. Sold $7.5 Dec 2014, when VLCCF was approx $8 in mid Nov, but got totally caned in Dec (but still better than buying stock outright). Put will be assigned (deliberately) today on 19th Dec at expiration on the close today.

Table below summarises our stock position, which has an unrealised loss of approximately ($8.08 average price – stock close price $4.71 x 560 shares = -$1887). However we realised a gain earlier in the year (May 2014) of $1011, selling 200 shares at $14.15. So our total loss on the stock is about  -$876. However we have dividend reinvested, so that is lowering the average price as well (hence the 60 or so extra shares, over the original 500 share position). Original cost basis was 500 shares at $9.79 = $4895. So loss is -17%, however given that stock price is down -%52 since purchase, that could be claimed as a small victory.

Our aim is to try and get out of this position, with a patient long term approach coupled with option trades and tactical stock sales to reduce overall cost basis.

Stock PositionSharesCost Basis /
Average Price
Cost Basis Principal
Existing VLCCF position3608.873193.2
Dec 2014 $7.5 put assignment (deliberately assigned on 19th Dec 2014)200$6.51300
TOTAL560$8.024493.2

The implied vol is 140% (very high) in Dec 2014, so are looking at volatility strategies, namely selling options. The stock is cheap enough (under $5) to consider very conservative put selling strategies, which when coupled with high IV makes it a good candidate for the philstockworld.com style trade (or longer term premium selling). We havent done this trade before, so will be conservative on the first one.

Look at the option chains for June 2015 shows the $7.5 and $2.5 puts. This trade was executed by selling puts and selling calls (premium on both sides).

VLCCF150619C7.5CALL (VLCCF) KNIGHTSBRIDGE JUN 19 15 $7.5 (100 SHS) -5 $221.07 $0.44/Share
VLCCF150619P2.5PUT (VLCCF) KNIGHTSBRIDGE JUN 19 15 $2.5 (100 SHS) -5 $313.12 $0.63/Share

This makes $221.07 (call premium) and $313.12 (put premium) for a total of $552 if VLCCF finishes in between $2.5 and $7.5 in 6 months time. What are the possible scenarios in Jun 2015:

Closes Below $2.5: This is effectively committing to buy 500 shares at about $2.5 – total option premium of $1.07 (or about $1.43 per share). This would be a bad outcome, and would have average price of about $4.75 on 1000 shares. Assuming stock would not go bankrupt (!) would have to look at option premium trades again (to further lower cost basis), or just buy and hold and wait it out. This would not be good, but would be way better than buy and hold from $9.79 to $1 to $2 range.

Closes Between $2.5 and $7.5: since the IV is VERY high there is a higher likelihood that vol reduces over the lifetime of the trade, so that will also give a way to profit even if stock doesn’t move anywhere over the next 6 months. This is like a “psuedo” dividend assuming the stock stays in a ride range – the options market currently prices this at about at 50% chance of happening, but if the IV comes down the percentage chance of it happening will be reduced as well. The “normal” IV for this stock is about 40% and that would price it at about a 75% of chance of happening (much better odds). The P&L here would be the stock P&L, plus about 5 contracts x $1.07 option premium or about $535 (the “pseudo” dividend). If stock price is over $7 by Jun 2015 expiration then this is breakeven on the currently unreleased open positions, however if you add the $1011 profit from earlier in the year, then the breakeven since position inception is approximately $5 (which looks achievable, and is not a bad outcome given that the position was started at $9.79).

Closes above $7.5 : If the stock is above the $7.5 strike in 6 months, then the entire position will be assigned for a profit:   –  $8.08 average cost basis + $7.5 strike assignment + $1.07 option premium = about $0.49 profit on 500 shares. That would make a small gain on $250, which added to $1011 from earlier this year, would give about a 25% profit on original position (and would have exited with VLCCF position with a decent gain, not having given up on it when it was a loser as it is today).

Note: There are an extra 60 shares that have been acquired due to reinvested dividends, but that would just be bonus profit (e.g. if closed at $10, then would get $2.5 * 60 shares = $150 of extra profit). But that was not included above to keep calculations simpler.