Category Archives: Trade Lifecycle

Trade lifecycle from trade entry, updates, adjustments and trade exit.

Trading Gold Long Term Diagonal Spreads

This trade idea shows how to approach trading gold with long term diagonal spreads. The trade example shows how a bullish multi month GLD long call diagonal spread was entered and managed. This trade was IRA eligible so using multiple option legs does not generate lots of complex tax reporting, and there was no issue of paying extra capital gains if the trade is ultimately successful.

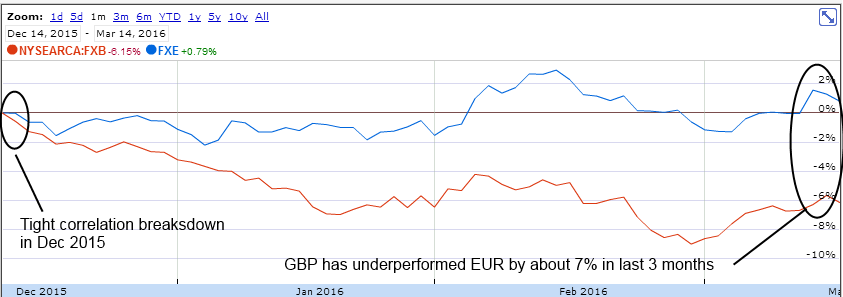
Gold market and GLD volatility overview

In March 2019 FED was signaling a rate pause which could be bullish for gold prices. This is an example of using options to express a “long gold” opinion in a portfolio, in this case using the physical Gold precious metal ETF (GLD)

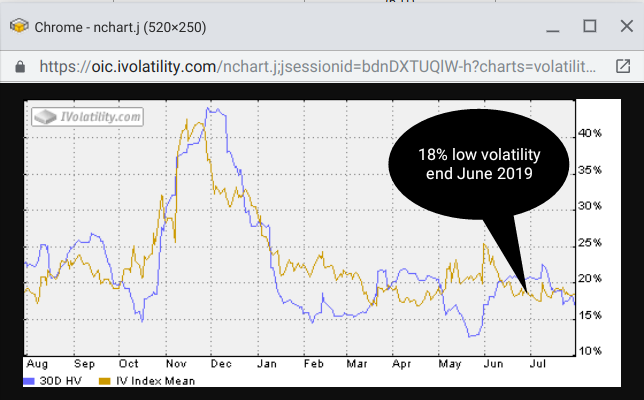
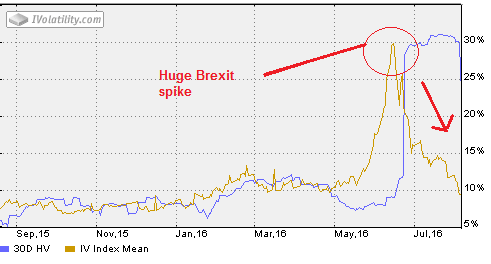
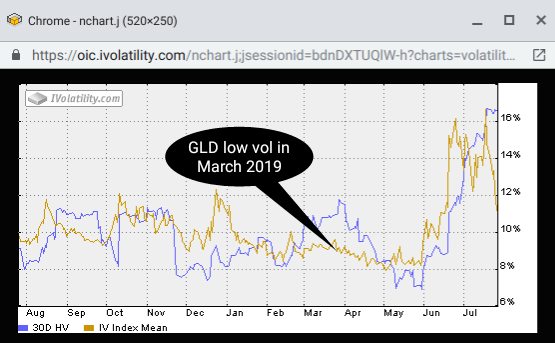
In March 2019 Gold volatility was approximately 9%, which was in the lower quartile (lowest 25%) for the last six months – having had a range of approximately 12% in Dec 2018, down to 8.5% in Feb 2019. Low volatility generally makes a better trade entry for long term calendar diagonal spreads. Importantly saying that “the volatility is cheap” only means relative to its own recent history in the last few months for this particular ETF or commodity. This does not mean that the underlying will not move around, because trading gold is historical volatile. This only means that the debit on trade entry is cheaper, simply as you don’t pay as much option time premium for the longer dated call (because the market is currently pricing less of an expected move by Sept 2019).
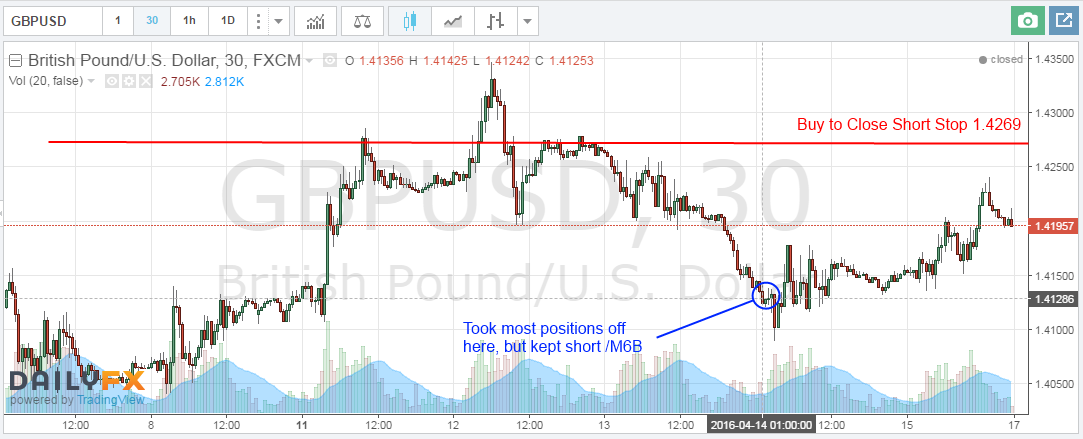
The chart below shows the GLD volatility chart for several months before and after trade entry on 22nd March 2019.

GLD July 2019 1 year volatility chart
trading gold - Long GLD Diagonal Calendar Spread - Volatility chart with Popup Balloon - 20190729

Trade Entry in March 2019

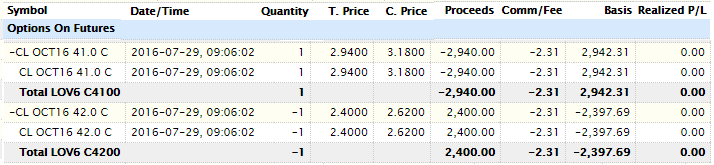
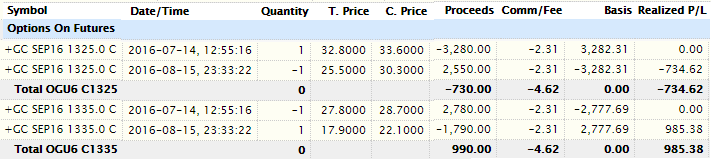
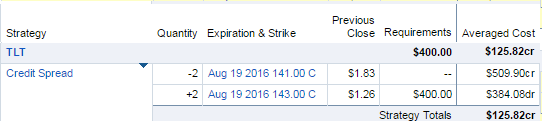
Having made a decision to long gold for 2019, the next step is to structure a suitable risk/reward trade within the 30 day rule. Here is the original trade entry when GLD closed at $123.97 on 22nd March 2019:

 
Trade Date
Category
Trans Type
Description
Symbol
Quantity
Price
Amount
22-Mar-2019
Portfolio
Sell to Open Short Call
Call GLD 128.00  EXP 17-May-2019
GLD190517C128
-6.0
0.77
$464.65

22-Mar-2019
Portfolio
Buy to Open Long Call
Call GLD 128.00  EXP 20-Sep-2019
GLD190920C128
6.0
2.70
-$1,622.29

TOTAL
$ 1157.64

<![if IE]><![endif]>


This trade was OTM so had approximately a 30% of being ITM at expiration - it was therefore a lower probability trade, but high conviction portfolio position ("long gold for next 6 months"). Losing the entire trade premium (defined at trade entry) was acceptable risk for the overall portfolio - but the payoff was potentially large for the relatively small initial risk, so it created the right risk profile to express the trade idea. Initially selling the shorter dated call help finance the longer dated call, and reduce the overall risk in the position. The intent is to avoid this shorter call being assigned and roll it multiple times over the summer to gradually chip away at the premium paid for the longer dated call.

Here are the main high level scenarios for the trade outcome - GLD stays in a range, goes up a lot or goes down a lot (just about covered all scenarios in finance there!):

If gold stays the same or rallies slightly towards but not through the short call, it can likely be bought back for less than it was sold for - this helps to reduce the basis on the original longer dated option. If this can be done over a few months rolling option calls can nicely reduce the basis on the original longer dated option. Usually selling the 30 delta OTM call is a decent starting strategy initially, but once the position basis is reduced then selling calls that are more than 30 delta OTM is ok.

If gold rallies strongly in the next month, it maybe difficult to roll the short call at a profit. This is a risk of the calendar spread strategy - the market call is "right" but gold rallies too fast, and the position makes little money. This happens because the negative delta of the short call becomes similar to the positive delta of the longer dated call - so the overall position can become delta neutral or even negative delta (short underlying) in a strong rally. On average though the short call can be managed with month to month adjustments.

If gold tanks in the next month, it maybe difficult to roll the short call to get any reasonable premium in the same strike in the next month. However if any premium is available in the next month call, then it can be sold at the same strike. In the situation where gold goes down, one luxury of any calendar spread strategy is to simply sit on the trade and hope it comes back. This is "ok" as a strategy with calendar spreads because the limited risk was defined at order entry.

Trade Adjustment in May 2019

The trade adjustment that was chosen in the end, was to let short call expire worthless and simply hold the longer dated Sept 2019 call option. This has keeps the trade risk to approximately $1150 but there is still now no upside cap and still plenty of time for the trade thesis to play out. The trade is now $464 better off than if we had just bought the long dated call for $1622. Sometimes doing nothing can be the best option.

Option Skew in July 2019

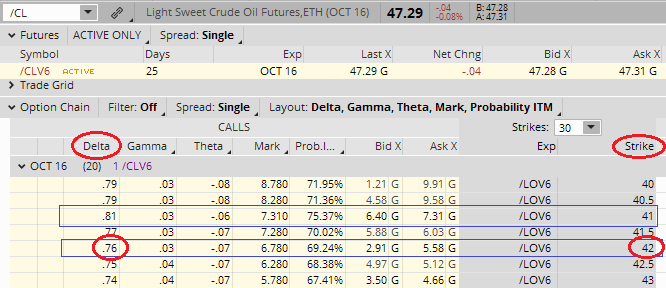
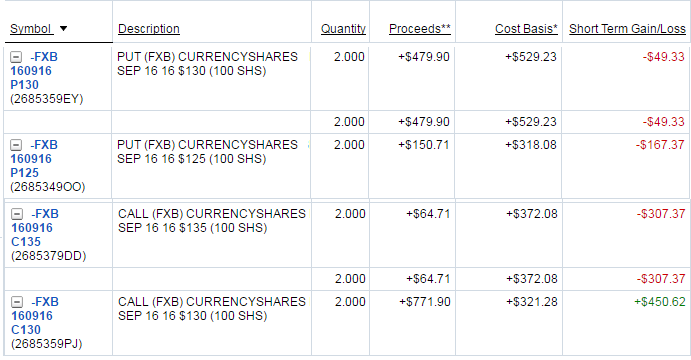
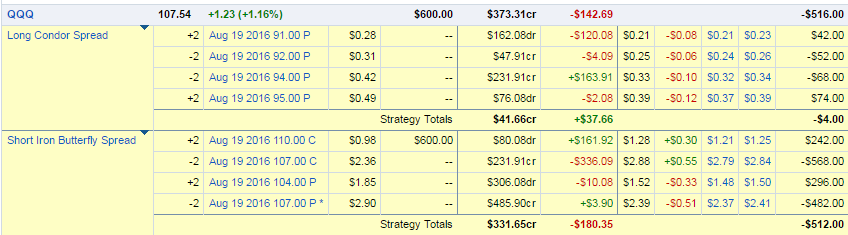
As of 29th July, the Sept 2019 Option premiums are indicating that the market is pricing in significantly more upside than downside for gold in the next 7 weeks. Looking at the option chain below shows the distance of both 30 delta OTM put and call options from the underlying GLD price.
trading gold - Long GLD Diagonal Calendar Spread - Option Chain Skew Sept 2019 - 20190729

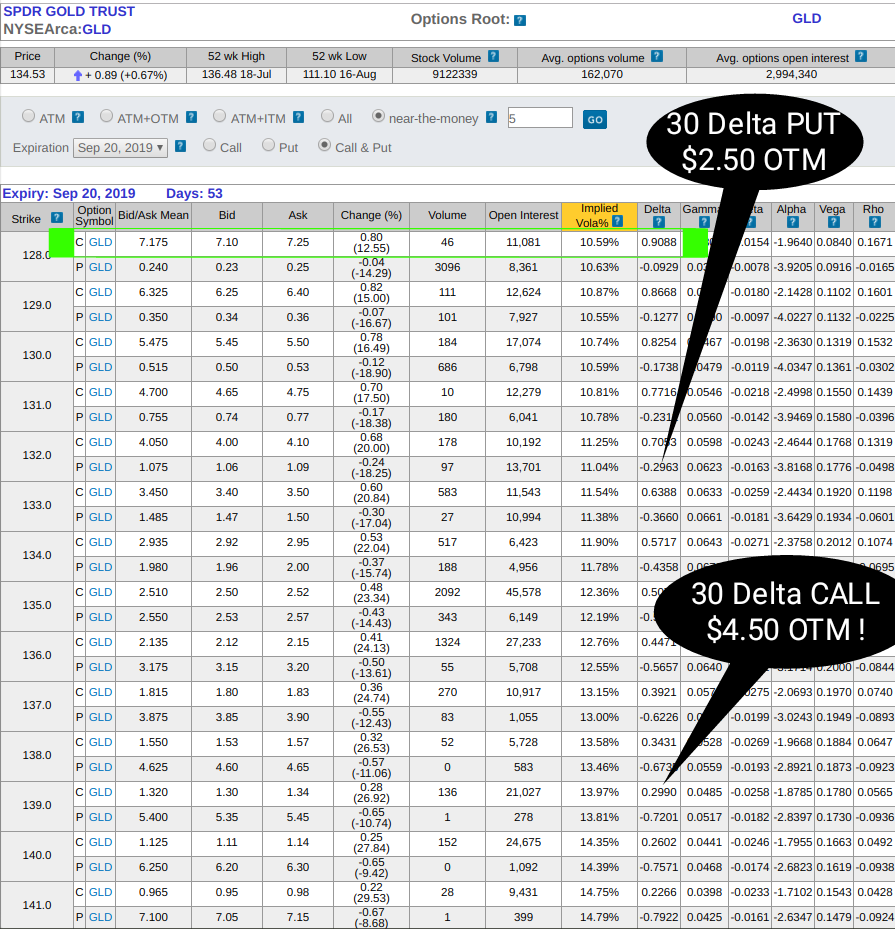
GLD is traded at $134.53 as of the NY close on 29th July 2019. Going 53 days to expiration on the Sept 2019 option chain, shows that the $139 call (with a delta of 0.2998) has approximately the same delta of the $132 put (with a delta of 0.2963). This means that market is assigning the 30% probability that GLD is $4.50 higher by Sept 20th 2019 expiration and a 30% probability that is $2.50 lower. That appears to be a huge bullish skew indicating that the market is still expecting higher prices in the medium term - despite the recent rally. If that bullish skew starts to disappear in the next few days, then would consider closing the long position, but for now content to hold until closer to expiration - especially because the option position only has a relatively small amount of remaining extrinsic value (time premium).

Specifically the extrinsic value (time premium) on our long dated call option is only approximately $0.65, with the majority being intrinsic value. Extrinsic value was calculated by adding the mean bid/ask for the option price ($7.175) to the option strike ($128), then subtracting the actual GLD market price ($134.53) = approximately $0.645.

Importantly this now means that the option delta is over 90%, so the position is trading like a stock position in the underlying. Since 6 calls $128 Sept 2019 are held, that representing a 6 x 100 x option delta = 600 shares x 0.9088 position = approximately equivalent to a 545 GLD share position. That represents a notional position of approximately 545 share equivalent x $134.53 = $73,318. There are some slippage in option bid/ask spreads and the option will move as GLD moves around - but that does give a good approximation of the current position size.

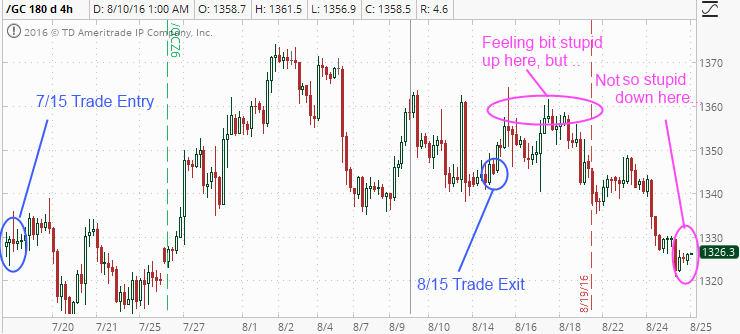
Trade Update in July 2019

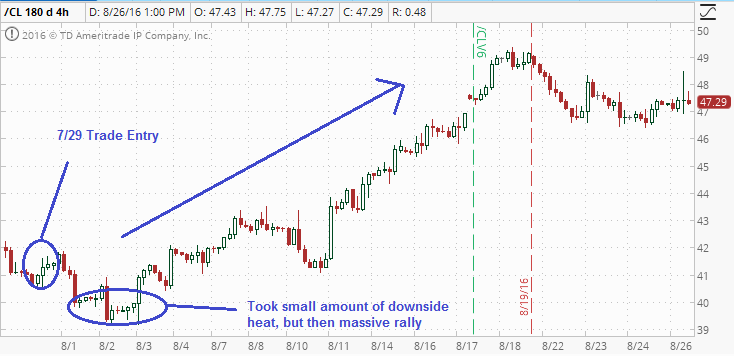
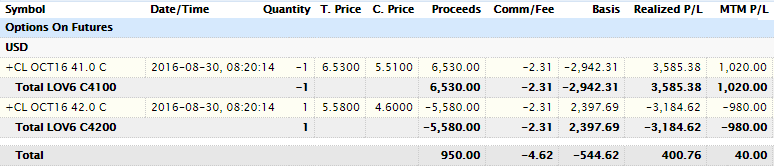
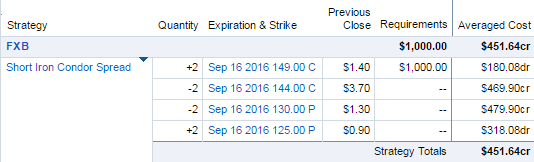
This is the current GLD price as of 29th July 2019, and the position has made nice progress after the trade entry on 22nd March 2019:
trading gold - Long GLD Diagonal Calendar Spread - Price chart - 20190729

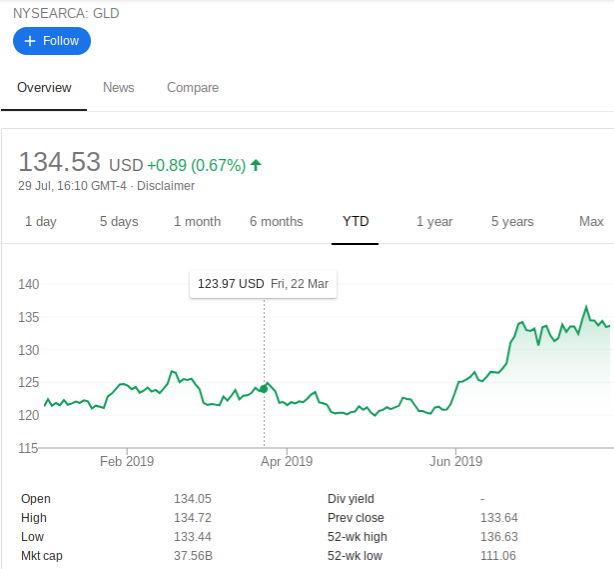
The current unrealised gain loss on the Sept 2019 call position $2727, added to the $454 from May 2019 expired call, gives a total gain for the overall position of approximately $3181. This is approximately a 276% return on capital so far.

These are some possible exit strategies as the option call is getting closer to Sept 20th 2019 expiration date:

Exit long dated call at a profit - simplest technique, but does not maintain any portfolio gold exposure which will likely be a good idea in a rate lowering environment. This can be done by either just simply selling the call, or by selling dated Sept 2018 ATM calls and hoping to deliberately get called away.

Roll long dated call up and out to a higher strike - this will depend if volatility is still high (over 10%) then this would be an expensive trade. Specifically because if the long option is significantly ITM and getting closer to expiration date (Sept 2019) - it will not have a lot of time premium left in it. Rolling the call up to several months out further out will likely incur some higher than desired premium (due to the high volatility environment). However rolling out could remove all risk from the position (if done for a $1150 credit) and would maintain a multi month GLD position into 2020.

Sell long date call, and switch to using "high volatility" strategy to maintain a long gold position - e.g. bull put spread

Summary of trading gold with long term diagonal spreads

In summary on 29th July the call option position represents an equivalent $73,318 long GLD position, that was acquired with about $1150 of risk. With this strategy there was initially a 30% chance of GLD finishing in the money above $128 by expiration (based on the option delta). The probability of a touch is defined as double the initial option delta - so that also means that over the trade lifecycle there is a approximately a 60% probability of GLD touching $128. To word that in a different way it means that at some point between Mar and Sept 2019 in all likelihood there will be about a 60% possibility of taking at least some profit from the trade. Additionally because we thought GLD would go up in 2019, then we also are thinking that the stated probability was under priced. That meant that using our bullish opinion on trading gold from the macro fundamentals has given us the opportunity to put the odds on our side.

Importantly this wasn't just like a lottery ticket style infomercial that says "I make 500% a week buying options" - where the stated returns are often from buying lottery ticket way OTM options that only make that "big" money occasionally, but on average is a losing option strategy. In summary the GLD strategy had:

  • a defined theoretical probability in advance
  • limited risk/reward
  • time for the investment idea to play out

This trade shows the power of option leverage, and why it is always a good idea to structure your portfolio to respect it - even if we just happen to be on the right side of it this time. This trade is still ongoing so no decision has been made yet, however it shows how to get to good risk adjusted returns using a relatively small amount of capital.

Mexican Bearish Put Diagonal Spread

This trade idea shows how to approach trading the Mexican Market ETF (EWW) with a slightly bearish bias. If EWW maintains its position or goes down slightly over the next month, then this position is likely a winner. The strategy will only make a limited amount of money if a large sustained selloff occurs immediately. The only main directional risk to the trade is a large rally higher. This trade was IRA eligible so using multiple option legs does not generate lots of complex tax reporting, and there was no issue of paying extra capital gains if the trade is ultimately successful.

Mexican market and volatility overview

Mexico has been in the news recently due to a lot of tariff talk. This has meant that the Mexican stock market has been trending down since April 2019. EWW has had a high of $47.18 in April 2019 and a low of $41.77 in March 2019. For the majority of 2019 the ETF has been in this trading range between approximately $42 and $47. This relatively confined range and lower volatility makes it a good candidate for a diagonal spread. The trend since April 2019 has been slow ping gradually down so rather than buck the trend we can enter a slightly bearish put calendar spread to take advantage of any ongoing minor sell off.

Mexican Bearish Put Diagonal Spread- Trade Entry Chart - 20190628

The volatility chart for the last year shows a very wide range of implied volatility there was a huge spike up to approximately 43% in December 2018 when the tarriff talk was at its height. They implied volatility has moved down a lot since then six months later and by the end of June 2019 is approximately 18% which is one of the lowest readings for the year. Therefore it is a good relative volatility level to enter a put diagonal spread that will benefit if volatility increases. We can continue to express a slightly bearish opinion without over paying on trade entry for option premium.

Short EWW Bearish Put Diagonal Calendar Spread - Volatility chart - 20190628

Mexican ETF Trade Entry in June 2019

The trade entry was on 28th of June 2019 as shown in the trade below:

 
Trade Date
Category
Trans Type
Description
Symbol
Quantity
Price
Amount
28-Jun-2019
Income
Buy to Open Long Put
Put EWW 39.00  EXP 20-Sep-2019
EWW190816P42
-6.0
0.72
$434.64

28-Jun-2019
Income
Buy to Open Long Call
Call EWW 43.00  EXP 20-Sep-2019
EWW190920P43
6.0
1.52
-$914.30

TOTAL
$ 479.66

<![if IE]><![endif]>


Summary of Mexican bearish put diagonal spread

This trade was OTM so had approximately a 40% of being ITM at expiration - it was therefore a lower probability trade. Initially selling the shorter dated put help finance the longer dated put, and reduce the overall risk in the position. The Mexican ETF EWW will hopefully drift lower over July without any major move either way.

Exiting Bitcoin Investment Trust due to Premium

This trade exit on GBTC describes how exiting Bitcoin Investment Trust due to premium was decided. The original GBTC position was purchased in March 2017. To recap the GBTC is an investment trust whose price is tied to bitcoin. The historically high premium to the actual underlying bitcoin price is the main reasoning for selling our GBTC position and replacing it with bitcoin and etheruem products that can replicate similar exposure (without that premium). This trade was IRA eligible so there was no issue of paying extra capital gains by selling after 11 months (instead of waiting for 12 months for long term capital gains to kick in).

Exiting Bitcoin Investment Trust due to Premium

The charts below compares an European based Bitcoin fund SE:BITCOIN.XBT (as a proxy for Bitcoin spot price) with GBTC. This clearly shows that throughout 2017 people have been prepared to pay a huge premium to own bitcoin in their US based brokerage account.

GBTC Feb 2018 1 year trailing premium
Bitcoin Investment Trust GBTC Trade Exit - Feb 2018 1 year trailing premium - 20180215

GBTC Feb 2018 3 month trailing premium
Bitcoin Investment Trust GBTC Trade Exit - Feb 2018 3 month trailing premium - 20180215

Combined with bullish Bitcoin 2017 price action and inflated premium, the GBTC price has moved up strongly. The above charts and Bloomberg show how the GBTC premium has moved for the last 12 months in a trading range of 50% to 120%. In only the last 3 months the GBTC premium has been as high as 120% in Dec 2017 and low as 30% in early Feb 2018. The premium trades aggressively higher on rallies and lower on sell offs. This behaviour has the effect of amplifying trading extremes, but increasingly makes it a less reliable buy and hold product.

As a recap, when the trade was entered in March 2017 GBTC premium had shrunk down to about 8% because there was the belief that a new Winklevoss Twins bitcoin ETF was about to be allowed by SEC. Once that was announcement was negative, the GBTC premium returned with a vengeance.

According to Bloomberg the average trailing 12 month GBTC premium was 53% (on 16th Feb 2017). By comparison the Bitcoin tracker fund premium was 0.08%. Additionally there is a 2.0% management fee associated with GBTC which is used to help manage the cold storage and security of the underlying bitcoin asset – so any premium paid on the actual GBTC spot price would seem to be excessive. The Bitcoin tracker fund management fee is 2.5% (higher) but since it trades at only 0.08% premium to NAV it is a relative “bargain”.

On 16th Feb 2017 GBTC had a 1 year performance return of 1,574.75% that more than double the Bitcoin tracker fund 1 year return of 774.33%. This is amazing given that the stated aim of the products is identical – the GBTC out performance results are exclusively due to premium.

For reference here are the Bitcoin and Ethereum products available that trade in Europe but can be traded in a US based brokerage account. These products do not have a huge premium to spot bitcoin and are IRA eligible. Bizarrely the swedish Krona product has the higher volume, over the Euro based product. All of these fund products introduce some currency risk exposure, but that is likely less to be way less variable than the GBTC premium risk.

CoinCurrencyInfo
Bitcoin Swedish KronaCOINXBT:SS
Bitcoin EuroCOINXBE:SS
Ethereum Swedish KronaCOINXBE:SS
EthereumEuroCOINETHE:SS

A Good Trade but Poorly Traded

This GBTC trade was ultimately a great investment, but one that was traded frustratingly poorly.

A small tranche was sold in May 2017 to cover the risk on the original position and the rest was left to run as “house money”. Clearly with hindsight that was the “wrong” thing to do, but is it good risk management on a very volatile product – and allows staying in the trade for a much longer amount of time. This risk management part was not poor trading, but the management of the resulting price action in 2017 can be improved – as discussed below.

The final run up into Dec 2017 was not well traded, and therefore missed the significant peak at $39, and survived the drop to $10 in Feb 2017, so decided to exit with some value still intact at $18. This is a very hard trade to take psychologically because of the anchoring to the high point at $39. However the 1300% returns in less than a year is still amazing, yet disappointing from a trading perspective. The split adjusted entry point was $1.44 so clearly this was all “house money” but some exit trading at higher prices should have been achieved into the Dec 2017 peak. This is not purely hindsight – it was clear the short term nature of the blow off top, even during Dec 2017. This does not mean the end of the bitcoin “bubble” – just a medium term trading top that should have been taken advantage of.

Bitcoin Investment Trust premium – Trade Exit

GBTC premium expands on rallies (up to 120% in Dec 2017) and contracts on huge sell offs (down to 30% in early Feb 2017). On trade exit at about $18 that is approximately an average 80% premium, which is somewhere in the middle of the range extremes for the last year. On trade exit with bitcoin at approximately $10k, the book value (or NAV) of GBTC was about $10, therefore there is approximately $8 of premium to nav (or about 80%). Therefore about 1800 shares of GBTC buys approximately one bitcoin, but the book value is about 1000 shares. Clearly there is a convenience premium, but 80% over book value is very high. That does not mean GBTC price cannot rise further, or the premium increase more in 2018. However if the premium ever shrinks to say 30% then it is quite possible to lose money in GBTC even if the bitcoin price goes up. When you buy GBTC at $18 about 45% of your purchase is premium (or “fluff”) over the price of the underlying bitcoin. That is a very hefty premium to spot.

Trade Entry was at GBTC split adjusted $1.44 (actual pre split price at that time was $131) in March 2017 when bitcoin was approximately $1250. Trade exit was $17.96 when bitcoin was about $10025 in Feb 2018.

Trade Replacement

The GBTC investment can be replicated without premium using the Bitcoin tracker funds. Since 1000 shares of GBTC represents approximately 1 Bitcoin, these trading approaches could be taken:

1. Sell 1000 shares of GBTC ($18,000 USD) and purchase $10k Bitcoin tracker fund – this maintains exactly 1 Bitcoin exposure. The remaining $8000 premium can be maintained as cash for future purchases if there is a pull back or for other investments. This maintains bitcoin only exposure.

2. Sell 1000 GBTC then purchase $10k Bitcoin tracker fund and $8k Etheruem tracker fund. This gives exactly 1 Bitcoin exposure but allows using the GBTC premium to buy a new Etheruem position. This has created a slightly more diversified crypto portfolio – but still fully invested in crypto, with no cash on hand.

3. Sell 1000 GBTC then purchase $6k Bitcoin tracker, $6 Etheruem, and keep $6k cash. This gives a less aggressive portfolio because it keeps some cash on hand in case of a pull back.

4. Sell GBTC and maintain cash to wait for a big pullback to invest. If you are a believer in the long term crypto currency bull, this is arguably the biggest opportunity risk – crypto prices are hard to predict and can be notoriously bubbly – so it having exited once at lower prices it is hard to reestablish at significantly higher prices.

These reallocation strategies are all tax optimal in an IRA.

Summary

There is a significant chance that if there is a bullish BTC price march in 2018 towards $20k again then GBTC will do very well. Indeed one day later BTC is already trading 10% higher at $11,000 (so clearly this is proving a badly timed exit). However there need to be discipline to recognize when that the GBTC trade now has premium risk outside of just Bitcoin spot price risk. That risk can be resolved by selling GBTC and buying bitcoin tracker funds.

This is not necessarily a price extreme for bitcoin, but a potentially a premium extreme in GBTC. Still bullish on bitcoin and crypto assets for the next few years, however GBTC may not prove to be a good long term buy and hold product (due to the premium).

In summary this is not purely a bitcoin play, but has become a play on the premium investors are prepared to assign for the convenience of exchange traded bitcoin product. Importantly selling GBTC is a not a bearish call on bitcoin or crypto in general, just trying to avoid being the last one out when playing musical chairs with the premium trade.

Oil Futures – Trade Exit – 29th Aug 2016

We can use Futures Options to enter a bullish oil trade using Crude Oil /CL Bull Call Spread – this gives a slightly bullish bias in oil. The Bull Call Spread is a limited risk reward trade with typically a one to one risk reward. The specific trade was entered on 29th July with $41 / $42 bull call spread when Crude Oil /CL was around $41.5 – essentially attempting to exactly middle the spread around the current price, but still defining the amount of risk to take. The trade cost $5.4, simply $540 per Crude Oil /CL contract. At expiration it could be exited for a max amount of $10 ($460 gain) or expire worthless for $0 ($540 loss). This was slightly worse than our typical 50/50 bet (about a 46/54 bet!) but it was close enough to get the trade executed, without having to wait too long for the market to position itself exactly in between the strikes.

Trade Entry

This shows trade entry prices:
CL Jul 2016 Bull Call Spread trade entry - 20160729

Looking at our portfolio, we also have on a post Brexit short CAD call spread that was acting as a nice counter balance to this trade. The Canadian Dollar /6C and Crude Oil /CL prices are positively correlated, meaning most of the time if oil prices go up, then Canadian Dollar would also rally.

Trade analysis

On 26th August /CL closed at $47.29 which is about $5.29 (12.6%!) over our max profit strike, which is very likely to realise the maximum profit of $460 if held all the way to expiration. The current open unrealised profit is $350. The blue rectangles on the Crude Oil /CL option chain below highlight the $41 and $42 strike options that make up the trade. The red circles highlight the strike and delta for the $42 call. This shows that the $42 call has about a 76 delta which meant that it had about a 76% chance of the spread being in the money by expiration (and making the maximum profit).
CL Jul 2016 Bull Call Spread option chain analysis - 20160826

However the 30 day rule period will be up on Monday 29th August, therefore we set the limit profit order to trigger at $400 profit or $9.5 limit (which is 85% of max profit). We would like $400 out of the trade, so we have to set the limit $0.1 higher to allow for commissions. With no commissions $400 profit would be $9.4, but including commissions it is $9.5. Technically there is $60 extra to make in this trade by holding all the way to expiration, but that would be about $940 risk to make $60 over 20 days into expiration so probably worth just closing it. It could be left to expire for next 20 days, but according to the option market there is a still a 25% chance that oil crashes to our higher $42 strike by expiration – so it is safer to exit on Monday for most of the profit and not have to worry about it.

The following chart shows the full trade life cycle marked up with our comments:
CL Jul 2016 Bull Call Spread chart trade analysis - 20160826

Oil Futures – Trade Exit

In the slight oil rally on 30th Aug the limit order was triggered and trade exited. This shows trade exit prices:
CL Jul 2016 Bull Call Spread trade exit - 20160830

In summary we made almost the full profit available in this trade, and exited as soon as possible after the 30 day rule allowed, but still let the market trigger the limit order for us to get the target $400 – this was a solid 74% profit on capital risked (profit $400 / risk capital $540 = 0.74).

Gold Futures – Trade Exit – 15th Aug 2016

Gold Futures – Trade Exit on 15th Aug 2016. We can use Futures Options to go through Bull Call Spread example. We originally entered a gold Bull Call Spread with a slight bullish bias in Gold, but mostly just to get some trades on. The Bull Call Spread is a limited risk reward trade with typically a one to one risk reward. Typically we would pick the options on futures that expire 45 to 60 days out. This gives plenty of time for the trade to move in the expected direction. This means that you don’t have to monitor the trade too closely throughout its lifetime, with is important with a 30 day rule.

However even if the trade is totally wrong, then can likely salvage a bit of value to either exit, or re-establish in the next monthly cycle. e.g. if the trade was placed for $500, it might only be worth $250. At that point could sell the whole spread, then do the same trade at the same strikes for the following month – this simply allows time in the trade if you still like the trade idea.

Gold Futures – Trade Exit

The specific trade was entered on 14th July with $1325 / $1335 bull call spread when /GC was around $1330 – essentially attempting to exactly middle the spread around the current price, but still defining the amount of risk to take. The trade cost $5, simply $500 per /GC contract. At expiration it could be exited for a max amount of $10 ($500 gain) or expire worthless for $0 ($500 loss).

This shows trade entry and exit prices:
GC Aug 2016 Bull Call Spread trade exit - 20160815

On 15th August /GC was about $1345 which is about $10 (0.75%) over our max profit strike, which is not a lot distance for the several days remaining in the trade. The trade had a profit of about $200 out of a maximum of $500, but clearly was only slightly out of money so that could be erased with a swift down move. However on investigating the delta of $1335 call gave about 63 delta which meant that it had about a 63% chance of making money by expiration. However we also know the probability of a touch at a higher strike is much higher than the probability of finishing at a particular strike at expiration. To define that another way – although this was currently looking like a marginal trade, there was still a high probability of exiting with a 50% of max profit ($250 profit target out of a maximum $500) between now and expiration.
There we set the limit profit order to trigger at $250 profit or $7.6 limit. Technically this would be $7.5 limit, but we set an extra $0.1 on the limit price (or $10 value) higher over our profit target to allow for commissions. The commissions on this trade are 2.31 for each option leg for entry and exit, which is $9.24, which is over time this adds up, so moving the limit by $0.1 covers those commissions nicely.
We then went to sleep, and luckily in the morning the limit had been filled due to a nice rally.

The following chart shows the full trade life cycle marked up with our comments:
GC Aug 2016 Bull Call Spread chart trade analysis - 20160825

In summary there was more profit available in this trade that ultimately we didn’t take, however we did make a solid 50% profit on capital risked. Also the trade reversed recently in the last week, meaning that if we had held on into expiration we would know be looking at -$200 loser (using today’s prices). The difference between taking the $250 or waiting for the -$200 loser is $450, so that is a significant swing for the trade size. Therefore taking the profit on the profit target was the right decision, and consistently taking profits on the winners helps balance out any future losing trades. We are getting better about not being disappointed with not making the “maximum” each time, and now we try simply moving on to the next trade.

Brexit exit iron condor

The pound has been relatively flat for a month after the initial Brexit trauma, so we are considering a “Brexit exit” on our existing iron condor. Currently the iron condor is in the middle of it’s range, as the FXB is at $129 and the mid point of our iron condor is $130. Volatility has contracted from 30% on the brexit announcement to around 15% and trending lower towards the original pre brexit range of 8% to 10% implied volatility.

FXB volatility

Looking at the historical FXB implied volatility chart clearly shows the huge peak for Brexit

Brexit exit FXB Aug 2016 Adjusted Iron Condor Volatility Analysis - 20160801

Given that our continued assumption is bearish on the pound, it makes sense to exit the iron condor before it sells off any further. Also the implied volatility contraction from a peak of 30% down to about 15% makes it more attractive to buy back the short option premium.

From our previous post the original trade was an iron condor at $149/$144/$130/$125 was placed on 16th June (pre brexit). Iron condor was adjusted on 27th June (FXB adjustment is in section “Brexit trading update – Monday”) by adding bull call spread $148/$143 and short call spread $135/$130.

FXB trade exit

The $130/$135 short out spread was slightly ITM giving the trade a slightly bullish deltas, and since our assumption is still bearish we are ok to close out the entire trade for a profit. Given that FXB moved more than 15% after brexit, this is definitely a good result. We could leave on the short call spread $130/$135 to keep short position on the table. However we are trying to more disciplined with our trading approach of “on as a package” and “off as a package” for option strategies. Adjustments to strategies in mid trade are ok, but fundamentally it is cleaner to exit and entry all option legs together. This ATM spread that had been already adjusted on with a short call spread vertical $130/$135, was taken off for a loss of -$73.

Brexit exit FXB Aug 2016 Adjusted Iron Condor ATM trade exit - 20160801

The call spread structure at $140 level is mostly worthless now. The generated a $216 profit and can be easily bought back for $50. It probably would be more logically to let the whole thing expire worthless because it’s way out of the money now, but in the interests of housekeeping we will exit now (on the same day the other side is exited). You could easily back an argument for doing nothing with this side of it, but we don’t have the patience to wait 40 days for it to expire to make only $50. All option legs of the entire OTM spread including the long call spread adjustment at $148/$149 was taken off for a gain of $216.

Brexit exit FXB Aug 2016 Adjusted Iron Condor OTM trade exit - 20160801

Brexit exit trade summary

In summary entire trade was exited for a $144 ($216 – $72) total profit across all options legs, but only with $200 at risk after each trade adjustment was applied (so it was a very safe trade). Without a trade adjustment this would have been a $36 winner, however with the potential max risk of approx $600. So in this case the adjustments ultimately made more money due to selling premium and importantly lower the overall max risk on the trade. This shows how in a volatile trading environment adjusting spread by selling premium, can both reduce risk and manage trade profitability. This was only a small profit, but it does show how to manage an option trade successfully even with a 30 day rule.

Brexit trading update – the aftermath

This will be the final general Brexit trading update – after this will resume general separate trade updates, but just wanted to get down all the trading moves made since last Friday and this week.

In summary it is a political mess in UK following Brexit. Prime minister resigned, opposition leader under threat for not campaigning strong enough for stay vote and Scotland threatening to veto the decision. On top of that Europeans telling UK to get on with a timetable for leaving. Not to mention the final hammerblow of England losing to Iceland in Euro 2016 (Brexit likely not as traumatic as the football exit for some people…).

However .. on to the trade update. If your trading account is still alive after the last few days after brexit… Congratulations! We were NOT expecting a leave vote to win, however we have to adjust our positions. Fortunately the implied volatility is still sky high on currencies and equities, so adjusting by selling premium is not that hard.

We are now now bearish USDGBP for the next few months. Not betting on immediate rebound. Any rallies are to be sold. There will probably be huge counter trend rallies based on discussions or actual BOE currency intervention, however those should be taken as a opportunity to short at higher levels. Limited risk reward with all bearish trades (eg call spreads or put / put spreads). Also medium term bearish on UK equities, but fallout from US equities will almost certainly be less for US versus UK. Not convinced that US market will react dramatically to Brexit over next few months (isn’t not likely on it’s own to cause a bear market). Would like to do short premium trades that take advantage of the high implied volatility env. Once again… if your trading account is still alive after the last few days of trading brexit your risk management rules are working.

Our portfolio had a relatively large number of short premium strategies going into the vote. These had to have minor some adjustments after the vote, which we did relatively quickly in most cases. There were also some strategic portfolio hedges to protect existing long positions that were quickly added on the Friday after Brexit (fortunately at pretty decent prices). Here are the trades we actually did …

Brexit trading update – Friday

Hedged our entire GBP cash position with a combination futures trade. This was hedged at 1.385 into the bounce on Friday morning at much better prices than overnight.
Brexit trading update - 6B Jun 2016 Bear Call Spread and Put - chart trade entry - 20160624

The combination /6B futures trade was needed to have full downside protection – without over paying TOO much for volatility (although some volatility premium needed to be sacrificed to hedge against total free fall).
Brexit trading update - 6B Jun 2016 Bear Call Spread and Put - trade entry - 20160624

Added these two bearish trades with a SPY put butterfly in the morning and IWM put butterfly near the close. These have no downside risk and were added when vol was high so could get strikes wide apart.

SPY put butterfly
Brexit trading update - SPY Jun 2016 Put Butterfly trade entry - 20160624

IWM put butterfly
Brexit trading update - IWM Jun 2016 Put Butterfly trade entry - 20160624

Hedged our entire Canadian dollar real estate position with a combination futures trade. This might be an over reaction to Brexit because the Canada/USA economic trading relationship is not likely to be directly affected. However if the market goes into “risk on” mode and oil prices decline then the USDCAD rate would suffer.
Brexit trading update - 6C Jun 2016 Bear Call Spread and Put - trade entry - 20160624

Brexit trading update – Monday

Shorted ATM volatility by adding a short call spread against the tested side of our existing FXB iron condor placed prior to Brexit. Also locked in a guaranteed profit on the short call spread by buying a very cheap call vertical. This is our way of rolling down within the confines of the 30 day rule – without this rule you’d just close out the call spread, and re-sell it at the lower strike. Trade has only $203 risk now:
Brexit trading update - FXB Jun 2016 Iron Condor trade adjustment - 20160627

Sold a QQQ iron condor similar to Tasty Trade’s good trade / bad trade – not our idea, but will take it.
Brexit trading update - QQQ Jun 2016 Iron Condor trade trade entry - 20160627

Short TLT bond call spread – don’t really like this trade from risk/reward (doesnt make much even if right) but just trying to sell bond premium in high vol with limited risk (and start a very small short position at recent all time highs).
Brexit trading update - TLT Jun 2016 Bear Call Spread trade entry - 20160627

Brexit trading update – Tuesday

Didn’t do much because implied volatility had contracted quite a bit, so there wasn’t that much premium to sell. Still not happy with QQQ and TLT positions – slight rise in market or bonds is going to hurt these positions.

Brexit trading update – Wednesday

Didn’t do much, big market rally again. Implied volatility reduced again. Sitting on hands for now. GBP rally somewhat muted given general “risk off” market rally.

Brexit trading update – Thursday

Portfolio is now getting too short for comfort – we have also iron condor established early in June in XME, EWZ that are rallying hard through the short call strike today. Adjusted the QQQ iron condor established on Monday to get some more long deltas in the portfolio.
Brexit trading update - QQQ Jun 2016 Iron Condor trade adjustment - 20160630

Brexit trading update – conclusion

Handled the actual event pretty well, but was caught off guard a bit because do not expect this massive bounce. Lost about 1% of the account in the bounce because pushing too hard on the short side (but that was arguably justifed given the initial market reaction). Ironic though because through out actual brexit in about Monday – the account was flat to slightly up. So navigated it pretty well initially, but frustrated to be losing money in last couple of days when did so relatively well on the initial reaction. Live and learn – and definitely not a write off experience.

Yet another Brexit Trade

Yet another Brexit trade! This is an interesting medium term trade idea – betting that the current hype around June 23rd Brexit poll in the UK is overstated. For the record personally don’t think that United Kingdom (uk) would vote for an eu exit. However there was a poll last Friday that had the leave campaign 10 points ahead.

Therefore due to the perceived risk of an exit the pound and stock markets sold off. Happily for our proposed trading strategy the implied volatility of the options has gone through the roof.

Typically on average implied volatility on options is overstated – and especially for know binary events (like stock earnings or polls). Therefore is makes sense to look at selling options, however with a potential huge move in event of a leave down you would not want to have unlimited risk. The aim is to “safely” sell premium without being on the hook for significant out sized moves of unknown magnitude.

The trade is do a longer term iron condor in FXB options. The only option cycles that are more than 30 days out and available this week are July 2016 (32 days) and Sept 2016 (90 days). Therefore we will pick Sept 2016 (90 days). This is the trade entered on June 15th:

FXB Jun 2016 Iron Condor Brexit trade entry - 20160615

There is still time to do a similar Brexit trade before Jun 23rd this week, as the option will likely remain highly bid up in price into the announcement.

Typically with a 30 day rule would like to give ourselves some wiggle room to exit the trade after the 30 day period has elapsed. This typically means a minimum of a couple of weeks after 30 day period to allow a strategic exit.
Is it possible to do options with only (for example) 32 days to option expiration, but then you have only 2 days at the end for trade exit and you end up very close to option expiration where the gamma risk is very high. We could wait for August 2016 cycle to appear after this June 17th option expiration, but we’d like to get trade on this week as implied volatility looks quite rich.

This Brexit trade is focused on the markets expectation of big move on the announcement itself. The assumption is that result is “stay” (status quo) and that after the announcement the implied volatility of the options reduces and the pound ultimately settles in a range after the announcement. It is important to recognise that the trade could instantly lose money on the announcement but this is capped due to the limited risk nature of an iron condor. There could be a lot of movement in the spread but the bet is that over about 30 days the pins will be in a similar trading range between 1.30 on down side and 1.46 on up side. If there is a sustained violent move in either direction this trade will lose. However according to option pricing on order entry it is has 60% probability of finishing inside the defined range by option expiration, so probability is higher to take a profit at some point during the trade lifecycle. After 30 days and up to 90 days it could move around inside the range if volatility collapses after the announcement as expected it could make money even if it trades outside the range, due to lower option premiums due a volatility crush. There are a lot of variables that make taking a profit on the trade a possibility between now and September.

Brexit Trade – Possible adjustments

Given that this has 90 days to option expiration there are plenty of opportunities to adjust. Typically this would be selling more premium to improve credit received. Even if the trade moved slightly outside the range, sometimes adjustments can be made. This would usually be done by turning the untested side into a butterfly, then selling a vertical close to the money to bring in more option credit. For example if FXB move rapidly upward this what we would do for our trade:
1) purchase a new cheap put vertical otm (to neuralise any downside risk from the existing short put spread).
2) sell a put spread closer to the money to bring in more credit.
This would increase the credit received AND make the trade initially more price direction neutral.

However given that this Brexit trade is limited risk reward it does not HAVE to be adjusted. If goes massively against us initially on the announcement we may have to be content with taking close to max loss. in a very extreme directional move (either way) sometimes there is no good adjustment with an iron condor. Therefore there is some risk that can’t be predicted, however is it limited to the known max loss on trade entry – as long as you are comfortable with the initial risk you shouldn’t have to worry too much about this trade over the actual announcement.

Brexit Trade – Trade Entry – Wednesday June 15th

FXB options are pretty lightly traded and typically have low volume and open interest. Trade entry is always extremely important to the overall iron condor strategy, but very important in more illiquid products. The best strategy is not to rush into getting filled as soon as possible – the trade duration is 90 days so the iron condor pricing will typically not move that significantly in one trading day on options that are that far out in time.
It is very important not to use a market order for this trade because you will get killed on the execution price. A good approach is use a day limit order to enter the iron condor, then cancel and correct if multiple times to get close to best available price. One of the interesting things we have noticed getting filled on illiquid options is that sometimes you can fills above what is considered fair mid price. So it is a good idea to start about 10% over fair value and work down in $0.01 or $0.02 increments. For example of the mid point credit offered is $4.00, start at $4.40 and work down towards $4.00, then keep adjusting down until you get filled. When you get close to mid price and the order hasn’t filled yet, you can leave an order in there for a few minutes to see if it will fill. If it doesn’t fill then just cancel and correct it again for a slightly lower credit. If it doesn’t fill, repeat for a lower credit. Obviously you don’t want to take all day to get the trade done. However in the long run it pays not to be too impatient with this approach, because over multiple trades the savings will add up.

The following is a general trading tip that admittedly only have our own experience to go on, but seems to hold true so far. We have noticed that option spreads in these less liquid currency ETF spreads (like FXB) tend to be a bit wider on the open between 9.30 and 9.45 and the close between 3.45 and 4. The guess is that market makers in these currency ETFs would like to get paid a bit more for hedging the illiquid option risk, especially overnight currency moves are digested. So it is typically easier to get slightly tighter fills on iron condors between 10am and 3pm, and we like to use 11.30 to 1pm (NY lunchtime) because on average the market seems slightly quieter.

Brexit Trade – Profit targets

After 30 days in this Brexit trade is reached we can start looking at profit targets. Typically would look to buy to close the entire iron condor by entered a good til cancelled limit order – that will get triggered at say $2. That would give about $2 profit. Even after 30 days the options will still have about 60 days to option expiration, so this is primarily playing a volatility collapse, not time premium decay. The volatility will likely collapse after the announcement so option premium should decrease significantly.

Brexit Trade update – Monday June 20th

Option volatility reduced on Monday as the market perceives that Brexit is less likely. Risk assets (equities) rallied an fear assets (precious metals) declined assuming that a “Remain” vote was priced in. Additionally the pound rallied 2% against the dollar. The lower option premium makes this trade less interesting now than last week. But interestingly the option volatility adjusted down significantly before the announcement (not on the announcement as we initially anticipated). However volatility could pick again after the announcement, but it is most likely to reduce significantly from current 25% implied volatility towards the last years average of about 10%. If this predicted option implied volatility collapse occurs it will help out our trade (even if the actual price moves against us).

Brexit Trade Exit – 18-Apr-2016

Last month Brexit Short Pound Long Euro Trade update we started a medium term trade betting that the pound will trade lower into June Brexit on fear of an exit poll. The trade was to short Great British Pounds (GBP) using 3 E-micro futures /M6B in Jun 2016 (symbol /M6BM6), and long Euro (EUR) using 2 E-micro futures /M6E in Jun 2016 (symbol /M6EM6). Each side had a notional value of approximately $26k USD. The 3:2 ratio is simply chosen so that the notional amounts are identical, because of the different contract size for each currency. Trade entry was 14th March 2016. We originally attempted to hold it as a position trade into the brexit referendum date in June 2016, but if our risk management rules take us out we will exit.

The Great British Pounds (GBP) future was the original short, and we sold Euro (EUR) against it to offset the risk somewhat. Because the Euro moves closely with the Pound over last year, this is a fairly closely correlated pairs trade. Pound is relatively flat for last month, and the euro had rallied a bit.
Recall from last month, we also had also completely hedged with opposite fx positions into the March 17th BOE meeting.

Profit Loss update at end week April 15th

Looking at the overall position on April 15th 2016 approximately 1 month later we have:
$250 profit on short 3 E-micro futures /M6B
$350 profit on long 2 E-micro futures /M6E
-$100 on long pound fx hedge
-$150 on short euro fx hedge

M6B Short April 2016 GBP Brexit Pair 20160415 - trade adjustment

Over this month the Pound has been down about 1% and Euro up about 1.5% (so not a huge amount of movement). However this price movement has given some options to make position adjustments.

M6B Short April 2016 GBP Brexit Pair 20160415 - 1 month correlation

We exited all positions, except the Pound future, for a total profit of $100. Then immediately added a stop to buy back the short pound at 1.4269 (entry was 1.4282). This stop was chosen only to allow for about 0.0013 slippage on the micro future and still guarantee a small profit of about $20 on the short future position. This would give us a total minimum profit of about $120 ($100 + $20) on the entire position, and still gives approximately a 1% wiggle room to the stop. However it is still possible (and potentially likely) to get stopped out, but crucially we can still maintain the short pound position with no risk from the overall trade. If we get stopped out, will likely be able to establish at better levels. If GBPUSD continues to go down, then will have established a decent sized position for no risk – if that happens, then likely would exit before the Brexit decision in next few weeks.

Final (enforced) Exit on Mon Apr 18th

Update: as of Monday, got stopped out this morning at 1.4270 so no longer have any position. Note the 0.0001 slippage from the actual 1.4269 stop. Cannot rely on stops to exit exactly at specified price, so always allow for some slippage between the stop and your required exit price. The slippage is typically dependent on product liquidity and when the stop executes. These FX Micro futures on /M6B are typically liquid with 0.0001 spreads during the day, but appear to move to 0.0002 in overnight US trading. You may get better executions during US hours. For example our execution was with only 0.001 slippage at 10.56am.

Total P&L was $120 – we had locked in a gain originally of $350, but that last adjustment from Friday cost us about $230 in giving back profits. However even though it got stopped out today, we did manage the risk well and ultimately turned the position into a “zero risk” trade.

Trade exit final review on Fri Apr 29th

Reviewing this trade again after the exit 2 weeks ago, shows that the in short term the trade theory was invalidated. The following chart shows how the trade would have moved significantly against it, if we had stayed in it.
M6B Short April 2016 GBP Brexit Pair 20160430 - trade exit review

However we did make a small profit – we might look a retrying this trade soon as these high levels. The importance of our risk management is that we are not emotional scarred from being wrong, so we can evaluate any new trade on its merits, not trying to get back to break even.

Brexit Trade Entry – 14-Mar-2016

This post describes a medium term trade betting that the pound will trade lower on uncertainty into the June 23rd UK referendum on whether to exit the European Union (EU) – dubbed Brexit by the media.

The trade is to short Great British Pounds (GBP) using 3 Micro GBP /M6B futures in Jun 2016 (symbol /M6BM6), and long Euro (EUR) using 2 Micro EUR /M6E futures in Jun 2016 (symbol /M6EM6).

Each side has a notional value of approximately $26k USD. The 3:2 ratio is simply chosen so that the notional amounts are identical, because of the different contract sizes for each currency. Trade entry was 14th March. This idea was from an FX Crosses trade idea from tastytrade.com, but one that we think we can use within our 30 day Rule restrictions. Typically this would be a scalping trade for few hundred dollars over a day or so, but we will attempt to position trade for a month or more.

For the record personally don’t think that United Kingdom (UK) would vote for an European Union (EU) exit, but with numerous exit polls and political statements along the way there will be a lot of uncertainty into the final results announcement on Jun 2016. However we don’t think we have a crystal ball so our personal opinion is not really relevant, therefore trade will be exited early and not wait for final result. This is trade is focused on the expectation of uncertainty into the result not the final result itself. This is a trade to “buy the Rumour, sell the news” trade or more accurately – because part of trade involves shorting pounds – it should be “sell the Rumour, buy back before the news”.

GBP EUR Correlation

The GBP EUR pair has a very tight correlation of about 0.71 in the last year. So what does that mean for our trade ? To recap correlation values typically vary between -1.0 (negative) and 1.0 (positive). A highly positive correlation means that the two products will typically move in the same direction mostly of the time (S&P 500 ETF (SPY) and Nasdaq (QQQ) would be a good example). A highly negative correlation means that the two products typically move in the opposite direction most of the time (S&P 500 ETF (SPY) and Volatility (VXX) would be a good example. Typically you would be looking for pair trades that were either below -0.5 or above 0.5 – because anything in between that range does not give enough of a correlation pattern (it could just be considered noise).

For the following we are using the relative charts of the ETFs FXB (Pound) & FXE (Euro) to show daily moves over a monthly time frame. For our high level correlation analysis, these E-micro futures move almost identically to these ETFs, so they can be considered equal for this analysis.

The GBP EUR pair has a very tight correlation for the 9 months of the last year, but there has been a recent 3 month divergence since Dec 2015:
Brexit - 6B Mar 2016 Pound Euro Pair 20160314 - 1 year correlation

For reference in the last month has extremely tightly correlated:
Brexit - 6B Mar 2016 Pound Euro Pair 20160314 - 1 month correlation

However looking at a zoomed in chart of the last 3 months it is easy to see that GBP has underperformed EUR by about 7%:
Brexit - 6B Mar 2016 Pound Euro Pair 20160314 - 3 month correlation

FED meeting – March 16th

Apart from general market risk, the FX market experiences higher implied volatility and rapid directional moves around central bank announcements. The FED announcement on March 16th and BOE announcement on March 17th will affect this trade.

This trade was not made delta neutral into FED meeting on March 16th. This is because the direction of euro and pound will likely be the same, even if the actual direction is unknown before hand. This trade does not make money guessing direction correctly, it makes money assuming the Pound under performs the Euro in the next month or so. Typically the euro and pound will trade in the same direction, but because we are long/short as a pair in the same amount the direction risk is minimized. It is possible, but not very likely, that the Euro and Pound trade in opposite directions after the FED announcement.

BOE meeting – March 17th

However this trade was made delta neutral before the BOE meeting on March 17th. This was because this is event directly specific to one of the currencies in the trade pair. Remember the aim of the trade is to express the view that the Pound will be weaker than the Euro over the lifetime of the trade into a potential Brexit – however trading central back announcements is just a trade outcome that cant be easily predicted and FX rates react in a very binary way (up or down very quickly). Since this event has the potential to move the GBP side of pair significantly, this introduces unnecessary event risk into our pair, so we will neutralise the trade for the event, and then re-evaluate afterwards.

The trade was totally hedged the night before the event, by purchasing about $26k GBP/USD spot FX and selling about $26k EUR/USD (the exact opposite of our futures position). We cannot exit any trade legs immediately due to the 30 day rule.

At luck would have it, after the BOE meeting at 8am EST on March 17th, GBP moved rapidly higher (i.e. against our original position). By 4pm Thursday compared to 24 hours earlier before the BOE announcement (but after the FED announcement) GBP was 1.53% higher and EUR was 0.76% higher. If we had remained unhedged in the original futures only position into the BOE announcement, this would have lost approximately 0.77% of our trade, or would have lost about $200 of our unrealized $350 profit. However since the trade was now totally delta neutral so our unrealized $350 profit remained, because the spot FX positions exactly offset any movement in the micro futures (as expected).

Brexit Trade Exit – March 17th

Since we have a locked in guaranteed $350 gain, we may just hold the entire structure for a month due 30 day rule then exit with a gain. In future we would also probably just use GBP/USD or EUR/USD spot FX (standard FX trades) versus the Micro GBP /M6B and Micro EUR /M6E futures. Given that the BOE meeting was bullish for GBP we can simply hold this trade with no modifications. However in 30 days time we can reestablish this trade (if we still want to trade the potential Brexit) simply by trading out of the spot FX positions. Alternatively we can just exit all the legs simultaneously and take the profit.